
Deskripsi
Memperkenalkan Stochastic RSI PRO untuk cTrader, versi lanjutan dari Stochastic RSI indikator yang dirancang untuk meningkatkan presisi trading Anda.
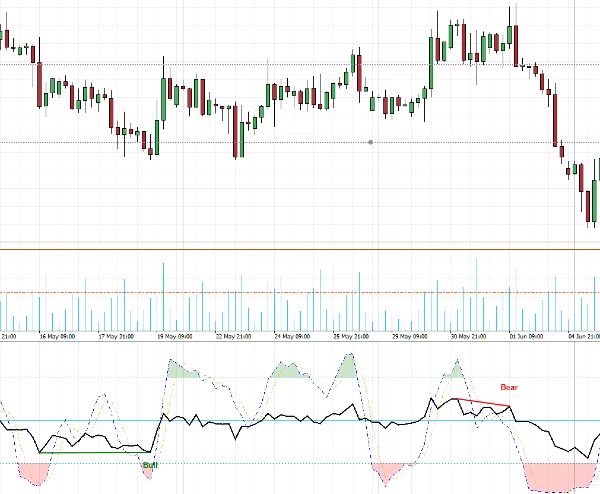
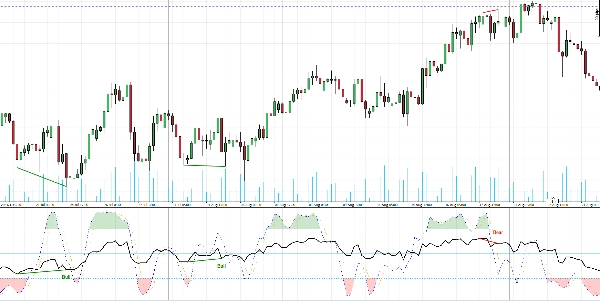
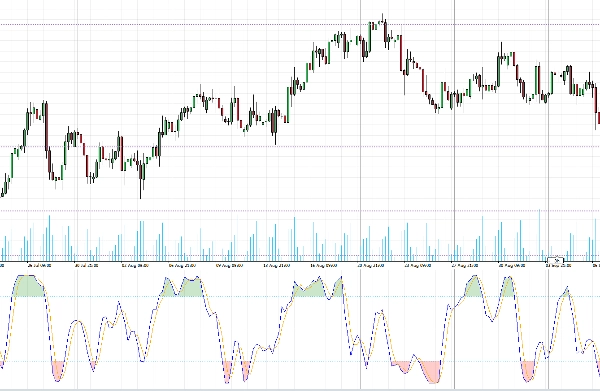
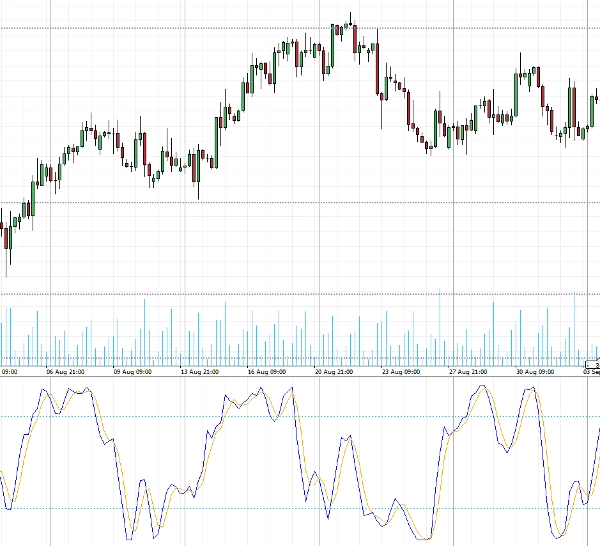
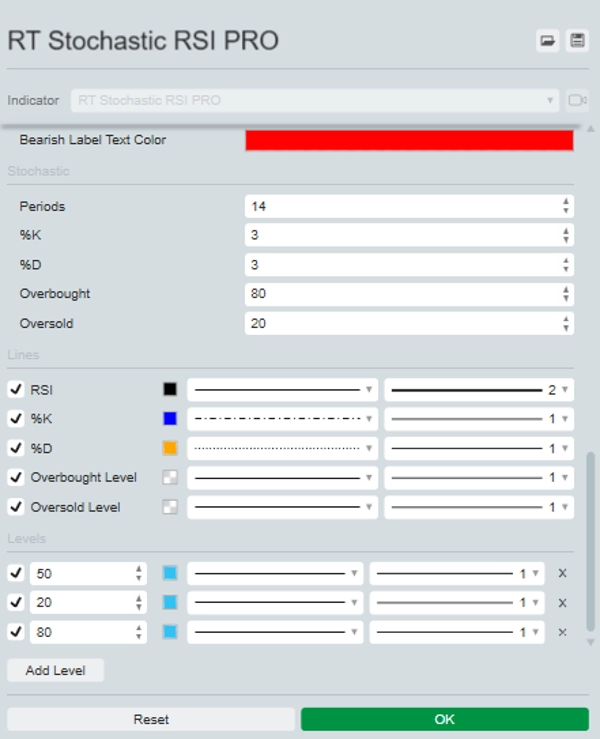
Alat yang kuat ini menumpangkan RSI langsung pada Stochastic RSI, memberikan pandangan komprehensif tentang momentum pasar. Ini menyoroti area jenuh beli dan jenuh jual dengan pewarnaan yang berbeda untuk memudahkan identifikasi.
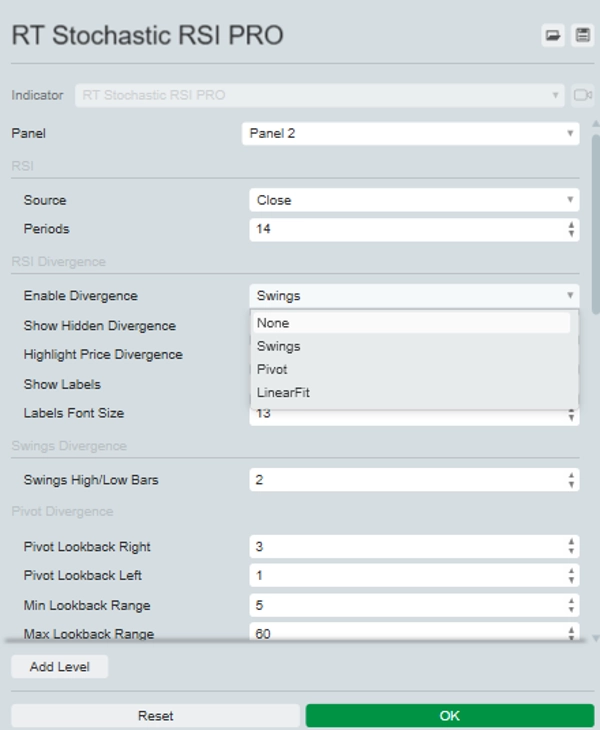
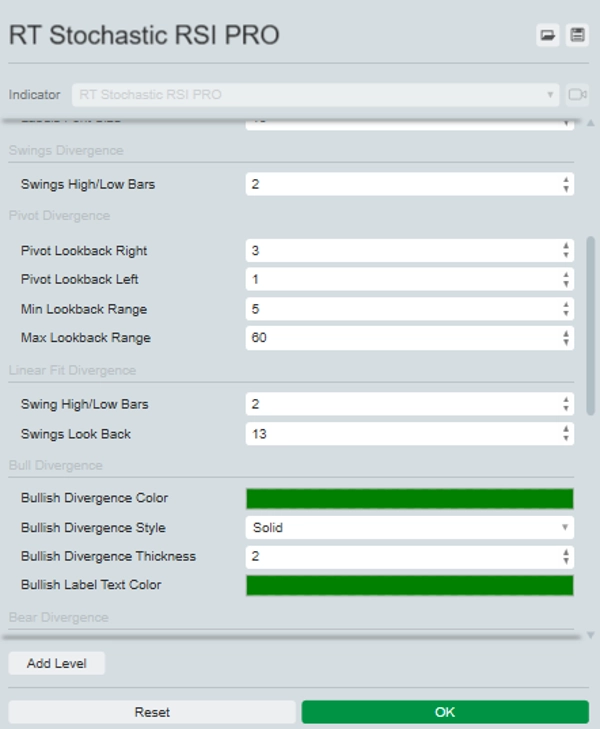
Fitur unggulan dari Stochastic RSI PRO adalah kemampuannya untuk mengidentifikasi dan secara opsional menyoroti baik divergensi reguler maupun tersembunyi pada grafik. Anda dapat memilih dari tiga metode untuk mengidentifikasi divergences: Swing, Pivot, atau Linear Fit, masing-masing dengan pengaturan yang dapat disesuaikan untuk menyesuaikan strategi trading Anda.
Tingkatkan analisis dan pengambilan keputusan Anda dengan Stochastic RSI PRO, alat yang wajib dimiliki oleh trader yang cermat.


