
Area of Interest
Indikator
2 pembelian
Versi 1.0, Aug 2025
Windows, Mac
4.0
Ulasan: 2
Deskripsi
1. Tujuan Indikator
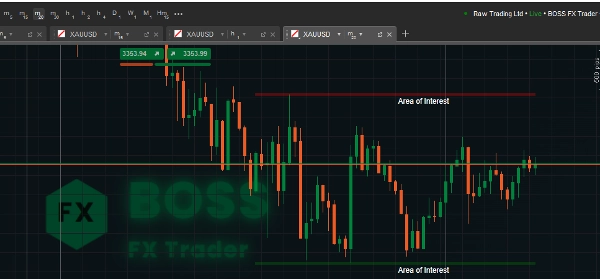
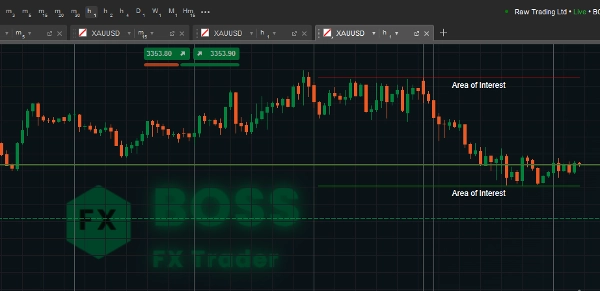
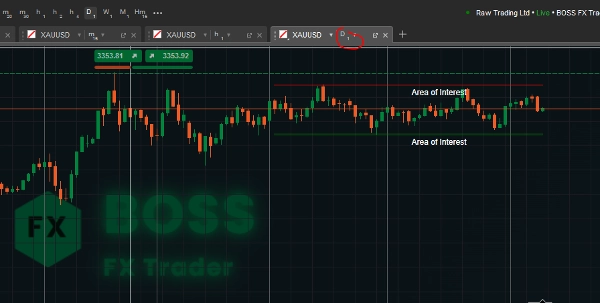
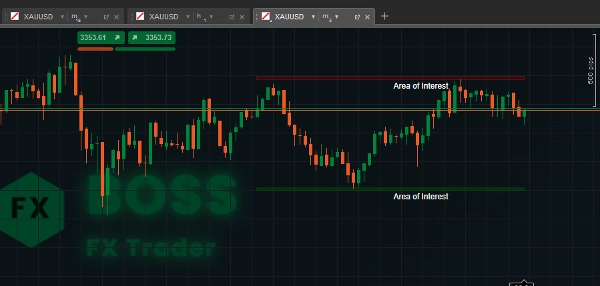
Indikator Area of Interest cTrader ini mengidentifikasi zona support dan resistance dalam periode lookback yang ditentukan pengguna, dan secara visual menyorotnya sebagai “Area of Interest” pada grafik Anda.
Ini membantu trader dengan cepat melihat level harga kunci di mana pembalikan atau breakout lebih mungkin terjadi.
2. Cara Kerja Kode
- Periode Lookback – Jumlah bar (lilin) sebelumnya yang akan dipindai indikator untuk menemukan harga tertinggi dan terendah.
- Nilai lebih tinggi → zona yang lebih luas.
- Nilai lebih rendah → level yang lebih baru.
- Tinggi Zona – Ukuran vertikal (ketebalan) area support/resistance dalam pips.
- Membantu membuat zona lebih terlihat dan dapat disesuaikan.
- Menghapus gambar lama sebelum menggambar yang baru untuk menghindari kekacauan.
- Mengumpulkan harga tertinggi dan terendah untuk rentang lookback.
- Menemukan level harga tertinggi dan terendah (resistance & support).
- Mengonversi tinggi zona dari pips ke nilai harga aktual.
3. Instruksi Penggunaan
- Pasang Indikator
-
- Buka cTrader, muat grafik, klik Indicators → Custom → AreaOfInterest.
- Sesuaikan Parameter
-
- Periode Lookback:
-
- Untuk swing trading → Gunakan nilai lebih besar (misalnya, 100–200).
- Untuk scalping → Gunakan nilai lebih kecil (misalnya, 20–50).
- Tinggi Zona: Sesuaikan dengan gaya trading dan volatilitas instrumen Anda.
- Menginterpretasikan Zona
-
- Zona Merah (Resistance) – Harga cenderung berbalik atau melambat saat memasuki zona ini.
- Zona Hijau (Support) – Harga sering memantul ke atas dari sini.
- Cari:
-
- Penolakan harga
- Pola candlestick (pin bars, engulfing)
- Konfluensi dengan indikator lain (EMA, RSI, Fibonacci)
- Contoh Trading
-
- Trading Pantulan: Masuk posisi beli dekat zona hijau dengan stop loss tepat di bawahnya.
- Trading Breakout: Tunggu harga menutup di atas zona merah untuk breakout bullish.
- Deteksi Break Palsu: Perhatikan ekor lilin yang melewati zona tapi ditutup di dalamnya (kemungkinan pembalikan).
Seorang trader yang menguntungkan menggunakan alat ini.
Ringkasan
Ringkasan AI
Area of Interest is a cTrader indicator designed to identify and visually highlight key support and resistance zones on trading charts. It scans a user-defined lookback period to detect the highest highs and lowest lows, marking these as “Areas of Interest” to help traders recognize price levels where reversals or breakouts are more likely. Users can adjust the lookback period to focus on broader historical zones or more recent price levels, and set the vertical size (zone height) of these areas in pips for better visibility. The indicator clears previous drawings before plotting new zones to maintain chart clarity. Resistance zones are displayed in red, indicating potential price reversals or slowdowns, while support zones appear in green, suggesting possible price bounces. Traders can use these zones alongside price action signals such as candlestick patterns and other technical indicators to inform trading decisions. Typical applications include entering long positions near support zones, trading breakouts above resistance zones, and detecting false breakouts by observing price wicks relative to the zones. The indicator supports customization to suit different trading styles, including scalping and swing trading, by adjusting the lookback period and zone height parameters.
Profil indikator
Ulasan pelanggan
4.0
Ulasan: 2
5 | 0 % | |
4 | 100 % | |
3 | 0 % | |
2 | 0 % | |
1 | 0 % |
Diskusi
Pertanyaan umum
Produk-produk yang tersedia melalui cTrader Store, termasuk bot trading, indikator, dan plugin, disediakan oleh pengembang pihak ketiga serta hanya ditujukan untuk akses teknis dan informasi. cTrader Store bukan broker dan tidak menyediakan saran investasi, rekomendasi pribadi, atau jaminan apa pun tentang kinerja di masa mendatang.


Harga
Sejak 29/05/2025
3.04M
Volume trading
45.22K
Pip dimenangkan
29
Penjualan
771
Instal gratis