
Deskripsi
VolumeProfileSuite adalah indikator Volume Profile yang canggih dan fleksibel untuk cTrader.
Tujuan utamanya adalah untuk menganalisis distribusi volume (yaitu, di mana aktivitas perdagangan terjadi) pada berbagai level harga untuk mengidentifikasi area "nilai" (volume tinggi) dan "penolakan" (volume rendah). Ini membantu Anda menemukan level support dan resistance paling signifikan berdasarkan aktivitas pasar nyata.
Fitur uniknya adalah menggabungkan dua mode analisis yang kuat menjadi satu alat, yang dapat dipilih melalui parameter Profile Mode:
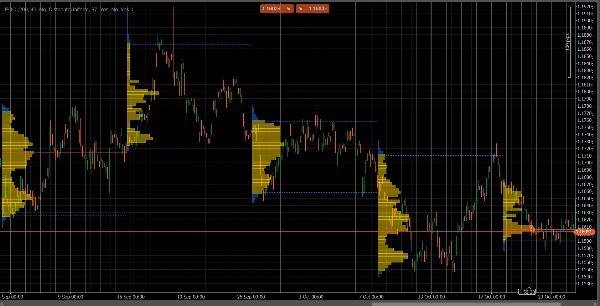
FixedRangeMode: Sempurna untuk analisis makro. Ini memungkinkan Anda menganalisis satu blok besar pilihan Anda (seperti 1000 bar terakhir atau rentang tanggal tertentu, misalnya, "semua minggu lalu"). Ideal untuk menemukan level support/resistance utama jangka panjang.PeriodicMode: Sempurna untuk analisis mikro dan perilaku. Ini secara otomatis menggambar profil baru setiap "N" bar (misalnya, setiap 100 bar). Ini memungkinkan Anda melihat bagaimana POC dan Area Nilai berkembang seiring waktu dan mempelajari pola berulang pasar.- Panduan Parameter (Bahasa Inggris)
Berikut adalah panduan terbaru untuk indikator VolumeProfileSuite baru Anda yang terpadu. Panduan ini penting karena menjelaskan parameter mana yang harus digunakan (dan mana yang diabaikan) berdasarkan mode yang Anda pilih.
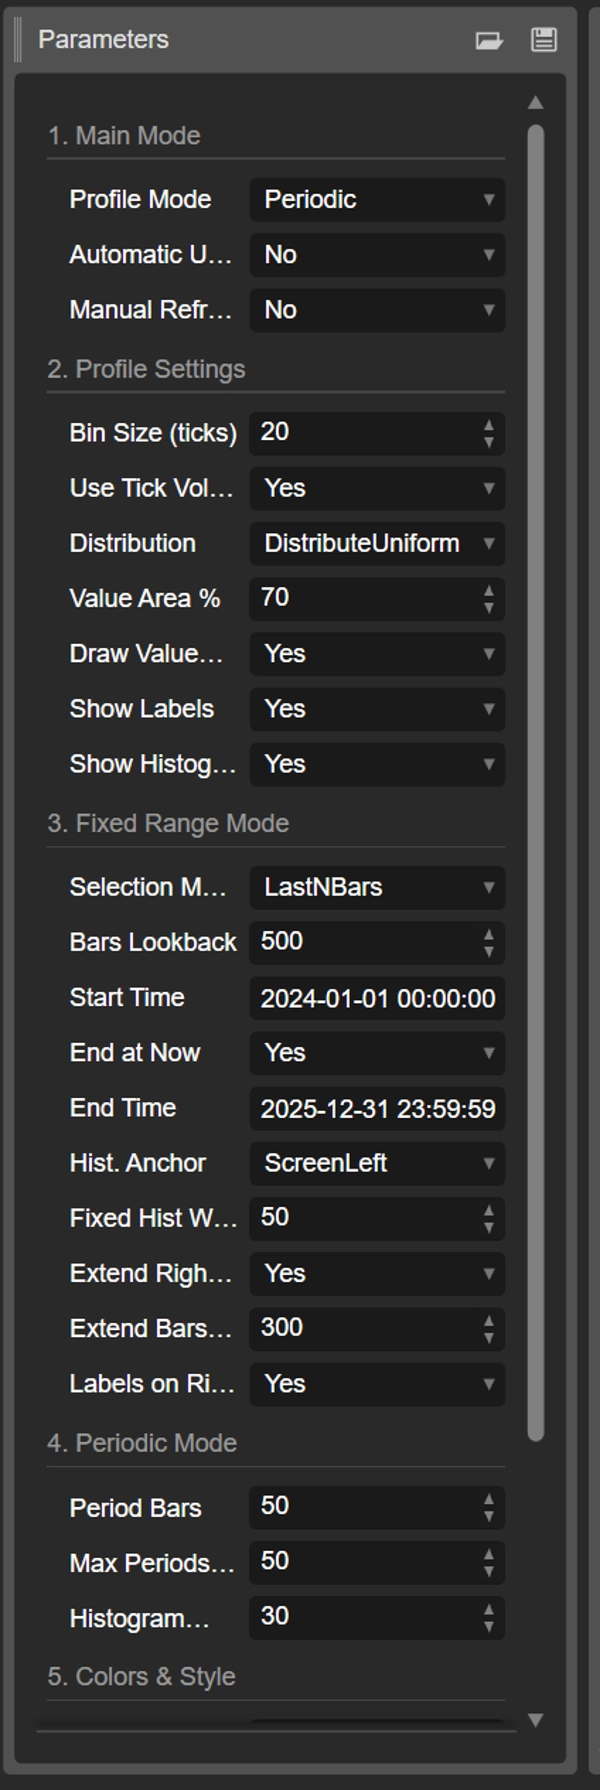
Grup 1: Mode Utama
- Profile Mode: Ini adalah parameter paling penting dan berfungsi sebagai saklar utama.
-
FixedRange: Mengaktifkan mode "blok tunggal". Indikator akan menganalisis hanya satu interval yang Anda tentukan (menggunakan pengaturan di Grup 3).Periodic: Mengaktifkan mode "siklus". Indikator akan secara otomatis menganalisis seluruh grafik dalam blok (berdasarkan pengaturan di Grup 4).
PENTING: Saat dalam mode
FixedRange, Anda harus mengabaikan semua parameter di "Grup 4: Mode Periodik". Saat dalam modePeriodic, Anda harus mengabaikan semua parameter di "Grup 3: Mode Fixed Range".
Grup 2: Pengaturan Profil
Parameter ini umum dan berlaku untuk kedua mode (FixedRange dan Periodic).
- Ukuran Bin (ticks): Mengontrol "resolusi" vertikal profil. Nilai rendah (misalnya,
1) menghasilkan banyak baris harga tipis (sangat rinci). Nilai tinggi (misalnya,10) mengelompokkan harga menjadi baris lebih tebal (kurang rinci, "lebih halus"). - Gunakan Volume Tick: Jika
true(direkomendasikan), profil menggunakan volume tick nyata, yang sangat akurat. Jikafalse, hanya menghitung "1" untuk setiap bar. - Distribusi: Menentukan bagaimana volume bar didistribusikan.
-
DistributeUniform(default): "Menyebarkan" volume bar ke semua level harga yang disentuhnya, dari rendah ke tingginya.CloseOnly: Menetapkan seluruh volume bar hanya ke harga penutupannya.
- Persentase Area Nilai: Menetapkan persentase volume yang membentuk "Area Nilai" (area aktivitas perdagangan tertinggi). Nilai
70(70%) adalah standar pasar. - Gambar Area Nilai (VAH/VAL): Jika
true, menggambar garis horizontal untuk Value Area High (VAH) dan Value Area Low (VAL). - Tampilkan Label: Jika
true, menampilkan label teks ("POC", "VAH", "VAL"). (Hati-hati: dalam modePeriodic, ini dapat membuat grafik menjadi penuh). - Tampilkan Histogram: Jika
true, menggambar histogram volume (bar horizontal).
Grup 3: Mode Fixed Range
⚠️ Gunakan parameter ini HANYA jika "Profile Mode" diatur ke FixedRange.
- Mode Seleksi: Memilih bagaimana mendefinisikan blok tunggal Anda.
-
DateRange: Menggunakan tanggal/waktu mulai dan akhir tertentu.LastNBars: Menggunakan N bar terakhir.
- Bars Lookback: (Hanya untuk
LastNBars) Berapa banyak bar ke belakang yang dianalisis (misalnya,500). - Waktu Mulai / Akhiri Sekarang / Waktu Akhir: (Hanya untuk
DateRange) Mendefinisikan awal dan akhir interval Anda. - Anchor Hist.: (Hanya untuk
FixedRange) Menentukan di mana histogram dipasang. -
DateRangeStart: Di awal interval Anda (bisa di luar layar).ScreenLeft: Di tepi kiri jendela yang terlihat.ScreenRight: Di tepi kanan jendela yang terlihat (di ruang kosong).
- Lebar Hist Tetap (bar): Lebar histogram (dalam bar) untuk mode
FixedRange. - Perpanjang Hanya ke Kanan: Jika
true, garis POC/VAH/VAL diperpanjang ke masa depan. - Perpanjang Bar: (Hanya jika
Extend Right Onlyadalahtrue) Berapa banyak bar untuk memperpanjang garis. - Label di Kanan: Jika
true, menempatkan label harga di ujung kanan garis yang diperpanjang.
Grup 4: Mode Periodik
⚠️ Gunakan parameter ini HANYA jika "Profile Mode" diatur ke Periodic.
- Bar Periode: Ini adalah parameter kunci untuk mode ini. Menentukan berapa banyak bar yang termasuk dalam setiap blok siklus (misalnya,
100). - Maks Periode untuk Digambar: 🌟 PARAMETER KEAMANAN! Ini membatasi jumlah profil siklus yang digambar untuk mencegah cTrader crash.
50berarti hanya akan menggambar 50 profil terbaru, meskipun riwayat lebih banyak. Jangan atur terlalu tinggi (misalnya, > 200) atau cTrader bisa membeku! - Lebar Histogram (bar): Lebar histogram (dalam bar) untuk setiap blok siklus.
Grup 5: Warna & Gaya
Parameter ini umum dan berlaku untuk kedua mode.
- Warna POC: Warna garis Point of Control.
- Warna VA: Warna garis VAH dan VAL.
- Ketebalan Garis: Ketebalan garis POC, VAH, dan VAL.
- Warna Histogram VA: Warna bar histogram di dalam Area Nilai (default: Kuning).
- Warna Hist Luar: Warna bar histogram di luar Area Nilai (default: Biru).
- Opasitas Histogram %: Transparansi (opasitas) seluruh histogram.
Ringkasan
The indicator offers two main analysis modes selectable via the Profile Mode parameter:
1. FixedRange Mode: Analyzes a single user-defined interval, such as a specific date range or the last N bars, suitable for macro-level, long-term support and resistance identification.
2. Periodic Mode: Automatically segments the chart into consecutive blocks of N bars, drawing a new profile for each. This mode supports micro-level and behavioral analysis by tracking how the Point of Control (POC) and Value Area evolve over time.
Common configurable settings include bin size (price resolution), volume type (tick volume or bar count), volume distribution method, value area percentage, and visual options such as histogram display and labeling. FixedRange and Periodic modes have distinct parameter groups to tailor their respective analyses.
Color and style options allow customization of POC, Value Area lines, and histogram appearance. The tool supports various markets including Forex, indices, commodities, stocks, and cryptocurrencies, as indicated by its relevant tags.
Ulasan pelanggan
5 | 50 % | |
4 | 50 % | |
3 | 0 % | |
2 | 0 % | |
1 | 0 % |


