
Deskripsi Indikator:
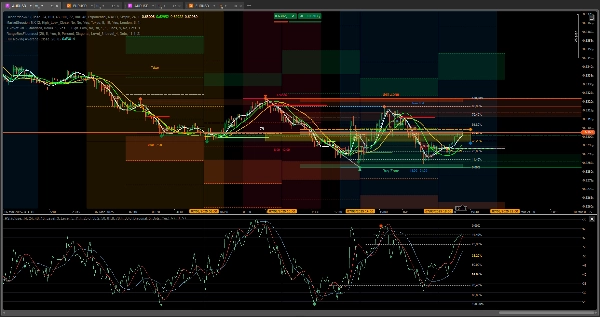
🎯 Indikator RSI dengan Level Fibonacci dan Hull Moving Averages 🚀
Ingin membawa analisis teknikal Anda ke tingkat berikutnya? Indikator ini untuk Anda! Ini menggabungkan yang terbaik dari tiga alat yang kuat: RSI (Relative Strength Index), Level Fibonacci, dan Hull Moving Averages untuk memberikan Anda pandangan pasar yang komprehensif dan akurat.
Fitur Utama:
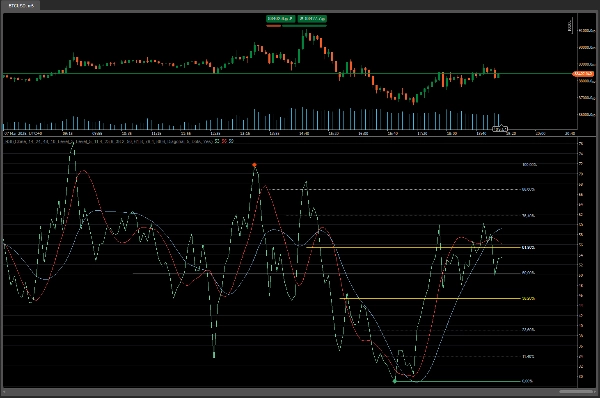
- RSI dengan Level Fibonacci:
-
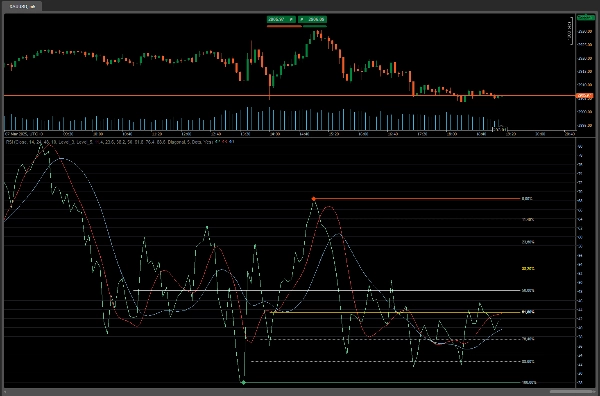
- Mengidentifikasi zona support dan resistance utama berdasarkan level Fibonacci.
- Membantu mendeteksi potensi reversal dan kelanjutan dengan presisi lebih tinggi.
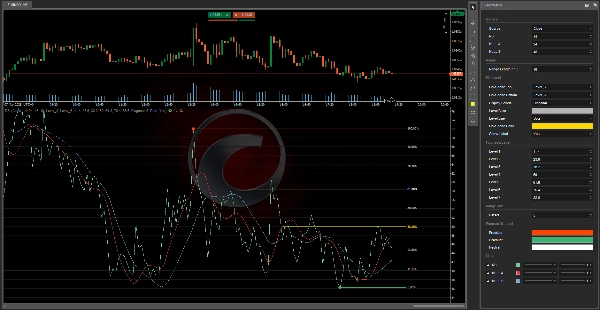
- Hull Moving Averages:
-
- Mencakup dua Hull Moving Averages (Hull A dan Hull B) untuk menyaring noise pasar dan menangkap tren dengan lebih efisien.
- Memberikan sinyal masuk dan keluar yang jelas berdasarkan crossover dan perubahan arah.
- Zona Perubahan Tren:
-
- Menyoroti area kritis di mana perubahan tren kemungkinan terjadi, membantu Anda mengantisipasi pergerakan signifikan.
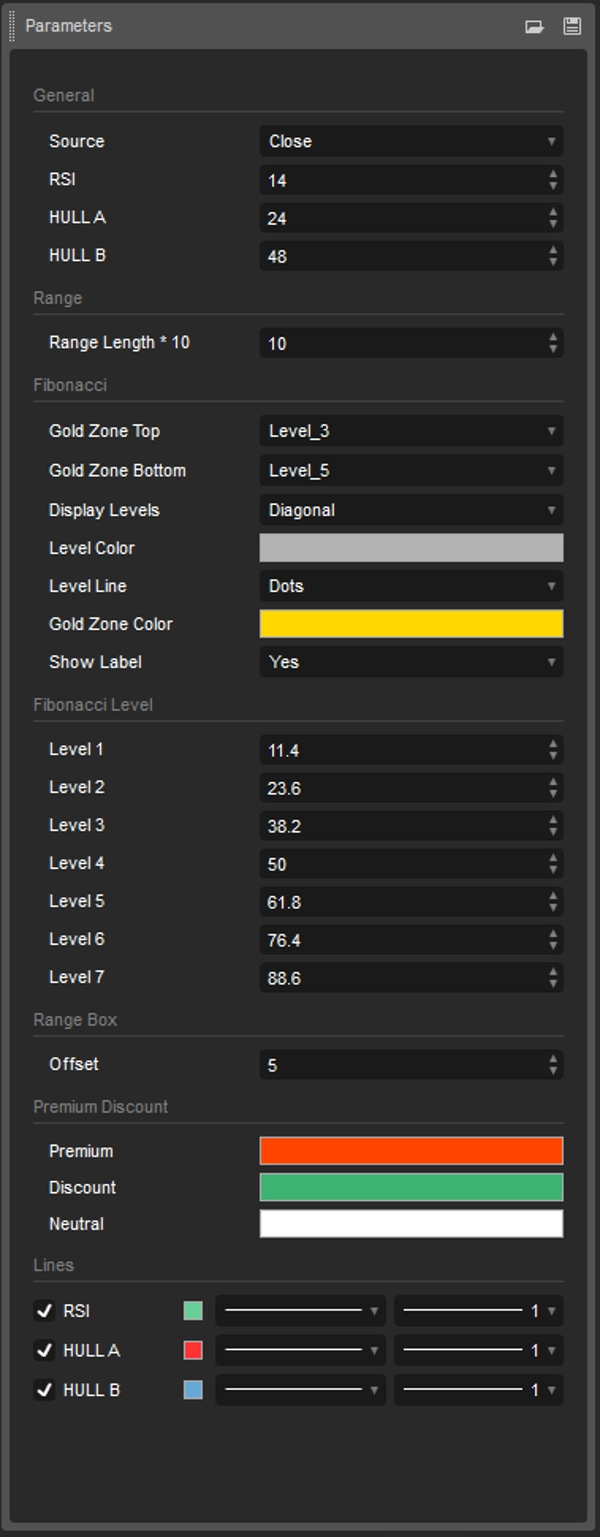
- Kustomisasi Penuh:
-
- Sesuaikan level Fibonacci, warna, dan gaya garis sesuai preferensi Anda.
- Konfigurasikan Hull Moving Averages agar sesuai dengan strategi trading Anda.
- Visualisasi Jelas:
-
- Ikon dan garis tren yang jelas untuk interpretasi cepat dan mudah.
- Label opsional untuk menampilkan level Fibonacci dalam persentase.
Manfaat untuk Trader:
- Akurasi Lebih Tinggi: Menggabungkan RSI dengan level Fibonacci dan Hull Moving Averages untuk sinyal yang lebih dapat diandalkan.
- Menghemat Waktu: Tidak perlu menumpuk banyak indikator; semuanya terintegrasi dalam satu alat.
- Serbaguna: Bekerja pada semua timeframe dan pasar (forex, saham, cryptocurrency, dll.).
- Mudah Digunakan: Dirancang untuk trader dari semua tingkat, dari pemula hingga ahli.
Mengapa Mengunduh Indikator Ini?
- Inovatif: Kombinasi unik alat klasik dan modern yang tidak akan Anda temukan di indikator lain.
- Efektif: Membantu Anda mengidentifikasi peluang trading dengan kejelasan dan kepercayaan lebih besar.
Cara Menggunakannya:
- Identifikasi Tren: Gunakan Hull Moving Averages untuk menentukan arah pasar.
- Cari Sinyal RSI: Periksa apakah RSI berada dalam kondisi jenuh beli atau jenuh jual di dekat level Fibonacci.
- Konfirmasi dengan Fibonacci: Gunakan level Fibonacci untuk mengidentifikasi zona support dan resistance utama.
- Buat Keputusan yang Tepat: Masuk atau keluar dari trading dengan kepercayaan lebih berdasarkan sinyal yang jelas dan tepat.
Unduh Sekarang dan Tingkatkan Trading Anda!
Jangan buang waktu lagi menganalisis grafik secara manual. Dengan indikator ini, Anda akan memiliki semua yang Anda butuhkan dalam satu tempat. Buat trading Anda lebih efisien dan menguntungkan!
Dan dengan dua alat ini Anda bisa berhenti khawatir tentang apa yang akan dilakukan pasar, dengan sekali lihat Anda akan tahu – beli atau jual dan lanjutkan ke tugas lain.
RangeBoxFibonacci: https://ctrader.com/products/526?u=VIZAINT
OrderPrice-V3: https://ctrader.com/products/397?u=VIZAINT
Dan untuk memilih
NTMPICLL https://ctrader.com/products/327?u=VIZAINT
MacdVolume https://ctrader.com/products/267?u=VIZAINT
MarketSession-MX: https://ctrader.com/products/525?u=VIZAINT
5 | 100 % | |
4 | 0 % | |
3 | 0 % | |
2 | 0 % | |
1 | 0 % |


