
Deskripsi
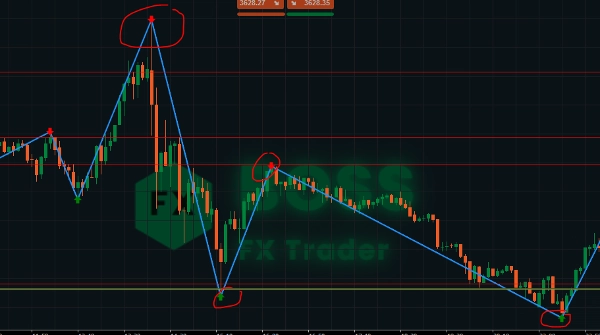
Indikator ZigZag adalah alat struktur pasar yang menyaring fluktuasi harga kecil dan menyoroti puncak dan lembah ayunan utama. Dengan menghubungkan titik-titik ini dengan garis, para trader dapat dengan mudah mengidentifikasi tren, pembalikan, dan pola grafik.
Indikator ini tidak menghasilkan sinyal beli/jual secara mandiri, tetapi ketika digabungkan dengan aksi harga, support/resistance, atau indikator lain, menjadi sangat kuat untuk strategi scalping, intraday, dan swing.
🔎 Fitur Utama
- Menyederhanakan kebisingan pasar dengan menunjukkan ayunan harga yang jelas.
- Membantu mengidentifikasi level support dan resistance.
- Berguna untuk mengenali pola grafik (head & shoulders, double tops/bottoms, triangles).
- Membantu dalam konfirmasi tren dan entri pullback.
- Indikator Panah Jual dan Beli
⚡ Scalping dengan ZigZag
- Kerangka Waktu: 1m – 5m
- Tujuan: Menangkap pergerakan kecil namun sering.
- Cara Menggunakan:
-
- Tunggu terbentuknya swing high/low baru.
- Tandai ini sebagai micro-support atau resistance.
- Masuk perdagangan pada breakout atau pullback ke level ZigZag ini.
- Jaga stop-loss tepat di luar swing terakhir (risiko ketat).
- Targetkan TP cepat (5–15 pips tergantung volatilitas).
👉 Bekerja terbaik pada sesi volatilitas tinggi (pembukaan London / New York).
⏱️ Trading Intraday dengan ZigZag
- Kerangka Waktu: 15m – 1H
- Tujuan: Trading tren harian dan pembalikan intraday utama.
- Cara Menggunakan:
-
- Identifikasi tren intraday utama menggunakan ayunan ZigZag yang lebih tinggi.
- Gunakan titik ZigZag sebagai zona pivot untuk entri (beli saat penurunan dalam tren naik, jual saat reli dalam tren turun).
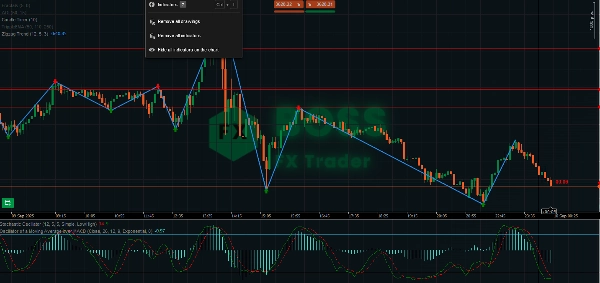
- Gabungkan dengan osilator (RSI/Stochastic) untuk mengonfirmasi kondisi jenuh beli/jual dekat ekstrem ZigZag.
- Gunakan swing high/low sebelumnya sebagai level SL/TP yang logis.
👉 Cocok untuk day trader yang menginginkan pergerakan 20–50 pip.
📆 Swing Trading dengan ZigZag
- Kerangka Waktu: 4H – Harian
- Tujuan: Menangkap pergerakan tren besar dan trading posisi.
- Cara Menggunakan:
-
- Gunakan ZigZag untuk mengidentifikasi struktur pasar utama (higher highs & higher lows = tren naik).
- Masuk setelah pullback ketika terbentuk swing low baru dalam tren naik.
- Tempatkan SL di bawah swing low utama terakhir.
- Targetkan 2–3x risiko, atau level ayunan ZigZag berikutnya.
- Gunakan ZigZag untuk mendeteksi pola pembalikan (double top/bottom, head & shoulders) untuk keluar.
👉 Ideal untuk menahan posisi selama hari hingga minggu.
📌 Tips Profesional
- Sesuaikan Depth: Lebih kecil = lebih sensitif (baik untuk scalping). Lebih besar = menyaring kebisingan (lebih baik untuk swing).
- Gabungkan dengan volume, filter tren, atau moving averages untuk konfirmasi.
- Selalu periksa ZigZag kerangka waktu lebih tinggi sebelum masuk — ayunan kecil dalam tren besar bisa menjadi jebakan.
- Gunakan ZigZag untuk validasi pola grafik (segitiga, wedges).
Tetaplah menjadi trader yang menguntungkan!
Ringkasan
Key features include simplification of market noise, identification of support and resistance levels, trend confirmation, and assistance with pullback entries. It supports multiple trading styles across various timeframes: scalping (1–5 minutes), intraday trading (15 minutes to 1 hour), and swing trading (4 hours to daily). Users can adjust the indicator’s sensitivity to suit different trading approaches and combine it with volume or moving averages for confirmation. The tool is applicable to diverse markets including Forex, indices, commodities, stocks, and cryptocurrencies, supporting symbols like EURUSD, GBPUSD, XAUUSD, NAS100, and BTCUSD.
Ulasan pelanggan
5 | 67 % | |
4 | 33 % | |
3 | 0 % | |
2 | 0 % | |
1 | 0 % |


