

Deskripsi
Mereka yang terlibat dalam perdagangan tahu betapa pentingnya memperhitungkan sesi sebelumnya.
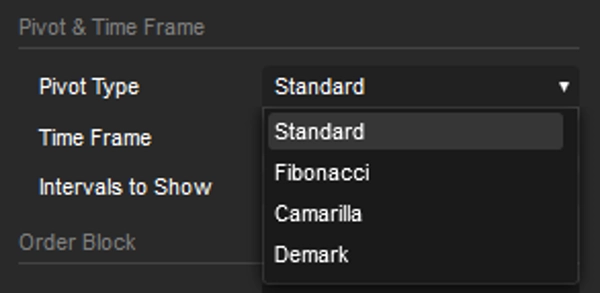
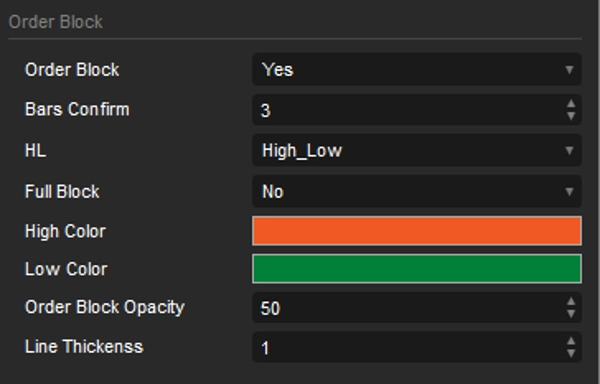
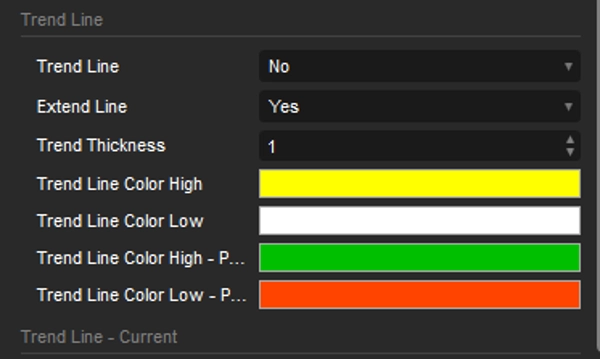
Saya telah menyiapkan indikator Pivot ini, dengan interval dari 15 menit hingga satu bulan, dan mencakup blok order serta garis tren. Kedua opsi didasarkan pada titik tertinggi dan terendah dari sesi sebelumnya.
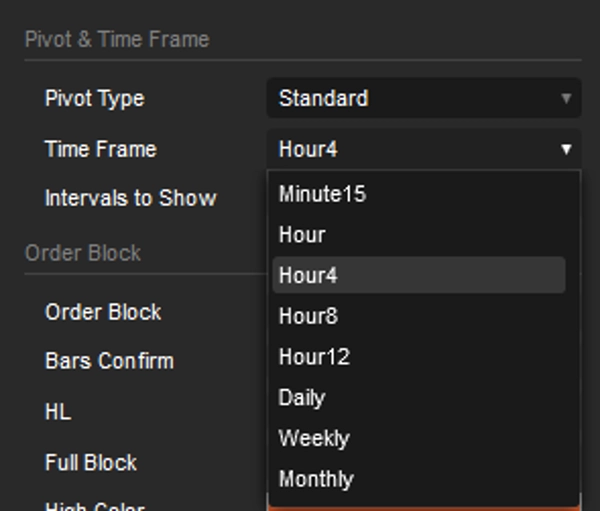
Konfigurasi default diatur untuk kerangka waktu 5 menit.
Pivot diatur ke 4 jam, dan intervalnya 5, yang berarti melihat kembali 20 jam dalam interval 4 jam. Ini sempurna untuk mereka yang berdagang harian.
Namun, jika Anda penggemar Swing Trading, Anda hanya perlu mengubah interval Pivot; semuanya akan menyesuaikan secara otomatis.
Blok order menyoroti area potensial di mana harga bisa menemukan dukungan atau resistensi, memberikan wawasan tentang kemungkinan pembalikan atau kelanjutan. Dengan menggabungkannya dengan garis tren yang dihasilkan secara otomatis untuk kerangka waktu yang dipilih, para trader dapat lebih akurat mengidentifikasi arah harga potensial serta titik masuk atau keluar yang mungkin. Kemampuan untuk memvisualisasikan garis tren ini di berbagai kerangka waktu memberikan pemahaman yang lebih lengkap tentang struktur pasar.
Dengan alat tambahan seperti
OrderPrice V3 https://ctrader.com/products/397
NTMPICLL https://ctrader.com/products/327
Range Box Level https://ctrader.com/products/245
Or RangeBoxFibonacci https://ctrader.com/products/526
Market Session https://ctrader.com/products/94
MacdVolume https://ctrader.com/products/267
4MA https://ctrader.com/products/247
Anda akan menjadi tak terkalahkan
Semoga berhasil 😀
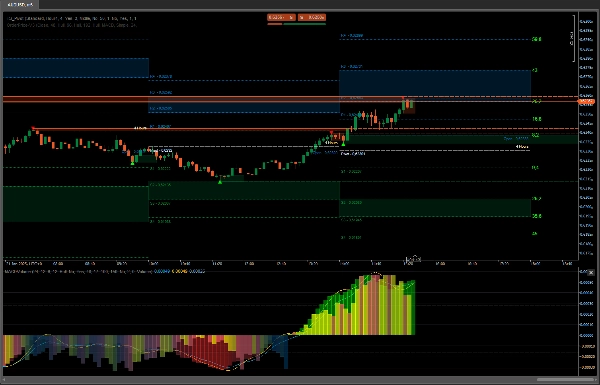
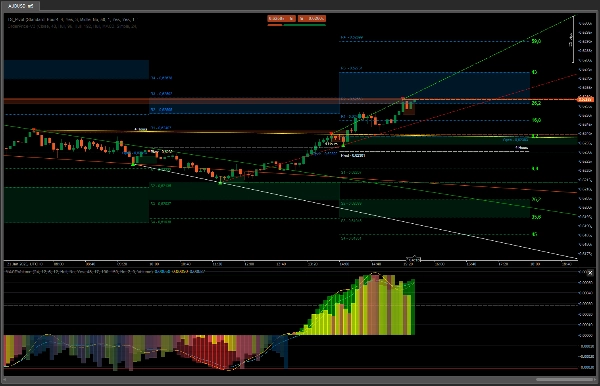
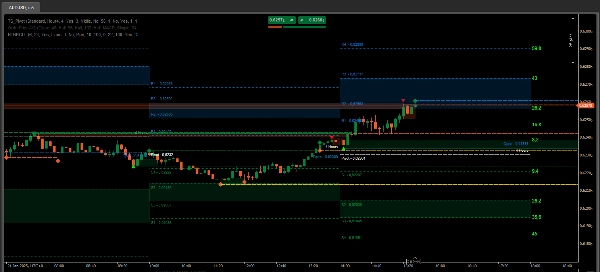
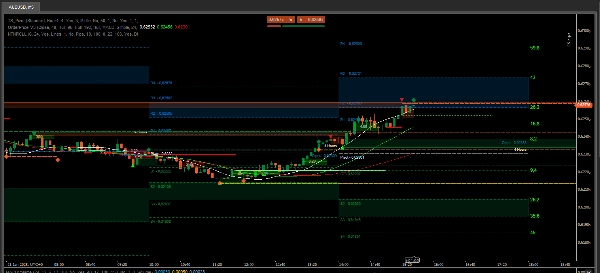
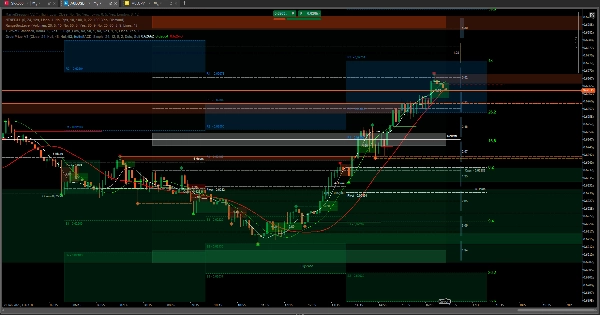
Dalam kasus pembelian, dengan mengamati dua gambar terakhir perilaku OrderPrice dan rata-rata bergerak yang terintegrasi, ketika garis hijau muncul dan rata-rata bergerak berada di bawah, itu adalah momen yang sempurna untuk membuka transaksi beli.
Dengan data dari sesi sebelumnya, Anda dapat menentukan seberapa jauh harga mungkin bergerak atau di mana resistensi mungkin terjadi. Jika menembus, harga mungkin melanjutkan ke titik kedua, yang bisa menjadi zona netral dari RangeBoxLevel. Jika melewati itu dan tidak ada tanda-tanda bahwa rata-rata bergerak ingin mengubah arah, harga bisa mencapai zona blok order dari sesi sebelumnya.
Dalam gambar terakhir, ada tangkapan layar dari situasi sempurna untuk masuk dan keluar transaksi. Sisanya hanya mengamati dan menarik kesimpulan.
Alat-alat ini sangat penting ketika berhubungan dengan kemenangan melalui perdagangan aset.
Ringkasan
Key features include the integration of order blocks and trend lines derived from previous session data. Order blocks identify potential support and resistance zones, aiding in spotting possible price reversals or continuations. The indicator automatically generates trend lines for the selected timeframe, helping traders assess market structure and potential price direction. Visualizing these trend lines across multiple timeframes enhances market analysis.
TS_Pivot can be used alongside complementary tools such as OrderPrice V3, NTMPICLL, Range Box Level, RangeBoxFibonacci, Market Session, MacdVolume, and 4MA to refine entry and exit decisions. By combining moving averages and order block signals, traders can identify optimal moments to open buy or sell positions. The indicator supports various markets including Forex, cryptocurrencies, commodities, indices, and stocks.
Ulasan pelanggan
5 | 100 % | |
4 | 0 % | |
3 | 0 % | |
2 | 0 % | |
1 | 0 % |


