
Deskripsi
1. Filter "Percepatan vs. Tren Garis Dasar".
Ini adalah keunggulan teknis nomor satu.
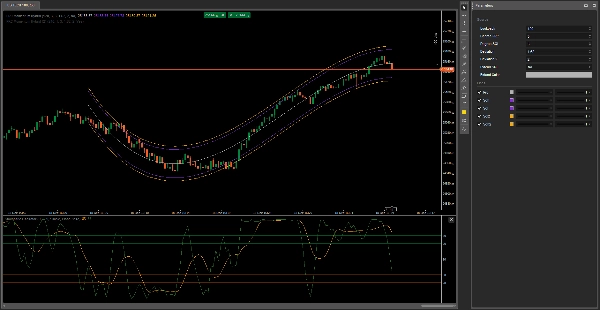
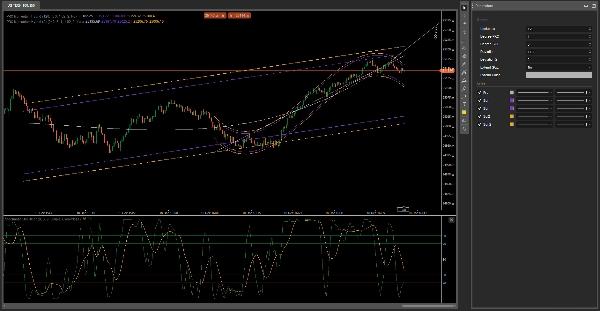
Level 1 (Garis Lurus): Mewakili inersia pasar atau tren rata-rata. Ini adalah "jalan tol" yang harus diikuti harga.
Level 3 (Lengkungan): Mewakili percepatan pasar dan sentimen emosional langsung.
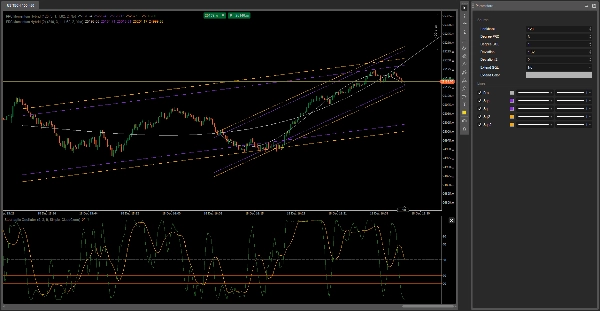
Keunggulan Trader: Ketika saluran Level 3 melengkung dan menembus saluran Level 1, ini menunjukkan klimaks pasar (kecepatan berlebih). Ini adalah peringatan sempurna bahwa harga terlalu melampaui dan akan segera kembali ke dasar linier.
2. Mengidentifikasi Tekanan Volatilitas
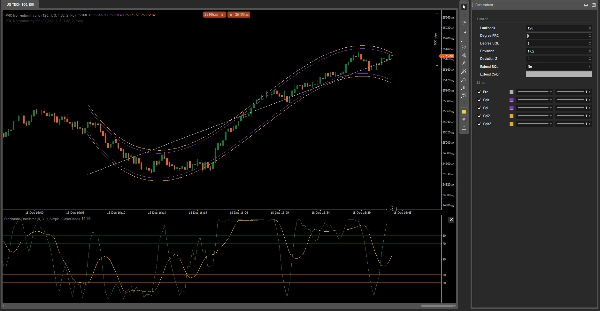
Keunggulan: Titik probabilitas tinggi terbentuk di mana garis oranye (lurus) dan ungu (melengkung) berpotongan.
Cara menjelaskannya: "Cari titik perpotongan. Ketika harga ditolak oleh garis lurus dan lengkungan secara bersamaan, Anda memiliki konfirmasi ganda bahwa harga telah menghadapi hambatan yang tak teratasi."
3. "Perangkap Tren" (Divergensi Visual)
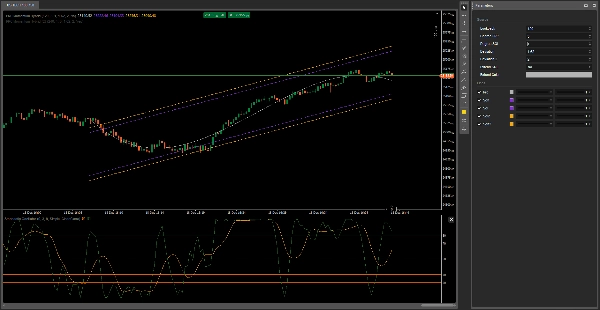
Keunggulan: Membantu menghindari breakout palsu.
Penjelasan: Kadang-kadang harga menembus saluran linier (Grade 1), memberi kita sinyal beli, tetapi saluran Grade 3 sudah melengkung ke bawah.
Nilai untuk pengguna: "Setup ganda kami melindungi Anda dari perangkap: jika garis lurus memberi tahu Anda 'naik' tetapi lengkungan 'membengkok,' tetaplah di luar. Lengkungan selalu mendeteksi kelelahan sebelum garis lurus."
Ini adalah alat yang membantu saya menghasilkan uang
https://ctrader.com/products/3441?u=Thomas-Sparrow
https://ctrader.com/products/526?u=Thomas-Sparrow
Ringkasan
1. Acceleration vs. Baseline Trend Filter: Detects market climaxes when the acceleration channel breaks out of the baseline trend, signaling potential price reversals from overextended conditions.
2. Volatility Squeeze Identification: Highlights high-probability trading nodes where straight and curved lines intersect, indicating strong price rejection points confirmed by dual resistance.
3. Trend Trap Detection: Provides visual divergence alerts to avoid false breakouts by comparing signals from the linear and curved channels, helping traders identify exhaustion before trend continuation.
The indicator supports analysis across multiple markets including Forex, Indices, Commodities, Crypto, and Stocks. It is intended for use as a powerful visual tool to enhance decision-making by identifying trend strength, momentum shifts, and potential reversal zones.
Ulasan pelanggan
5 | 100 % | |
4 | 0 % | |
3 | 0 % | |
2 | 0 % | |
1 | 0 % |


![Logo "[Hamster-Coder] Pivot Points (Demo)"](https://cdn.ctrader.com/image/webp/87b54299-8c73-4942-9207-4bc6db824811_31153)


