
คำอธิบาย
ตัวบ่งชี้วิเคราะห์ทางเทคนิคนี้ให้ข้อมูลเกี่ยวกับความรู้สึกของตลาด แนวโน้ม และระดับราคา โดยใช้ข้อมูลเช่น ปริมาณการซื้อขาย, เปิด_ปิด, ความผันผวนของ Chaikin และกระแสเงินของ Chaikin เพื่อคำนวณความรู้สึกของตลาด นอกจากนี้ยังช่วยให้คุณปรับสเปรด ตรวจจับแนวโน้ม และแสดงภาพระดับราคาและพิปส์ได้ เป็นเครื่องมือที่มีประโยชน์ในการระบุแรงที่มีอิทธิพลในตลาด คาดการณ์การเคลื่อนไหวของราคา และปรับปรุงการตัดสินใจในการเทรด
ในคำอธิบาย ฉันระบุพารามิเตอร์ที่สำคัญ; ส่วนที่เหลือเป็นการตั้งค่ารูปแบบ เช่น สี ประเภทเส้น และขนาดตัวอักษร
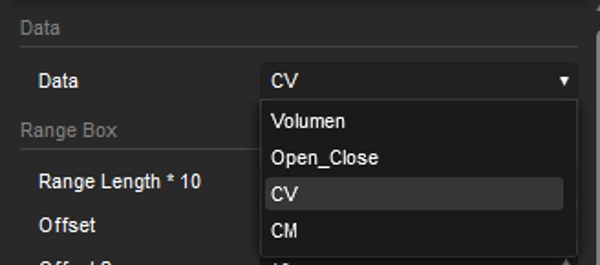
ข้อมูล
การคำนวณความรู้สึกขึ้นอยู่กับการเลือกจาก ปริมาณการซื้อขาย, เปิด_ปิด, ความผันผวนของ Chaikin และกระแสเงินของ Chaikin
ความยาวช่วง * 10
ค่านี้แสดงจำนวนแท่งเทียน (ช่วงเวลา) ที่ใช้ในการคำนวณ – ค่าจะถูกคูณด้วย 10
เพิ่มการซูม
เพื่อให้แผนภูมิอยู่ตรงกลาง นอกจากนี้ยังช่วยพิจารณาสถานการณ์เช่น การรวมตัวและการเปลี่ยนแปลงแนวโน้ม
ขอบ
ช่วยให้ปรับขอบบนและล่างเพื่อปรับปรุงการแสดงผล
แสดงความรู้สึก
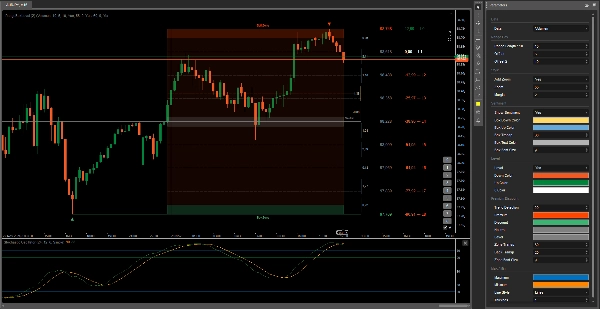
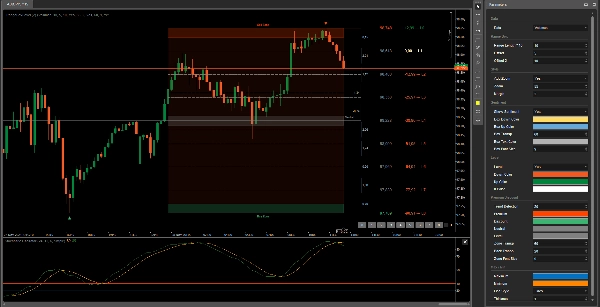
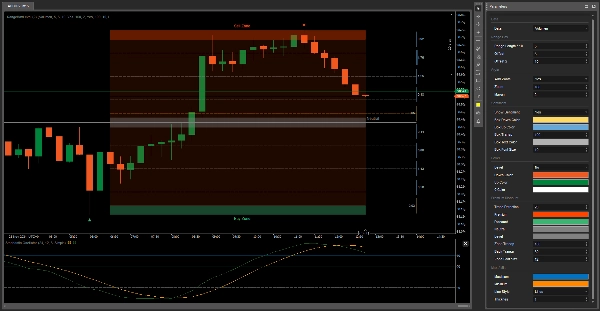
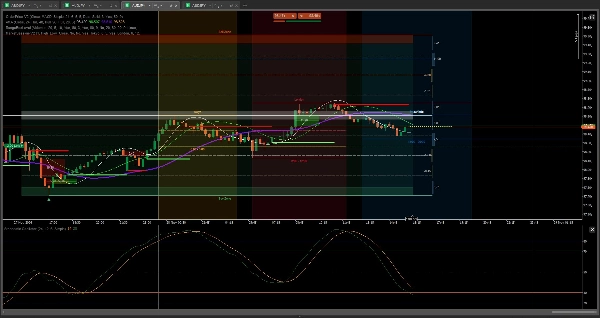
ความรู้สึกแสดงให้เห็นว่าแรงใดแข็งแกร่งกว่าตลาดในขณะนี้ หากแท่งสีเหลืองมีขนาดเพิ่มขึ้น หมายความว่ามีผู้ขายมากขึ้น และในทางกลับกัน หากคุณไม่ต้องการเห็นภาพความรู้สึก คุณสามารถซ่อนไว้ทางด้านขวาได้
ระดับ
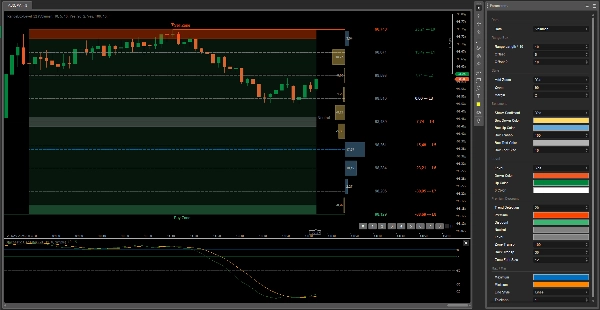
นี่คือฟีเจอร์เสริมที่สามารถใช้เป็นข้อมูลอ้างอิงสำหรับราคาและพิปส์ในแต่ละระดับ เมื่อคุณเลือกระดับที่ต้องการวางคำสั่งซื้อ มันจะแสดงพิปส์ในแต่ละระดับที่ราคาสามารถไปถึงได้
การตรวจจับแนวโน้ม
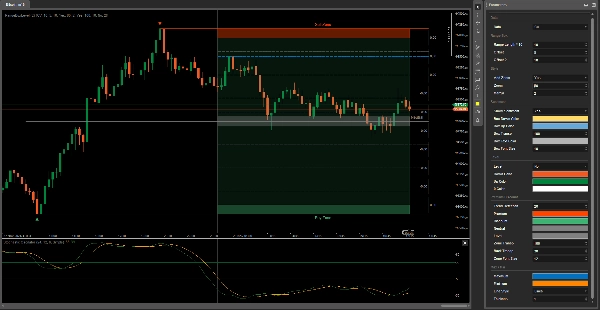
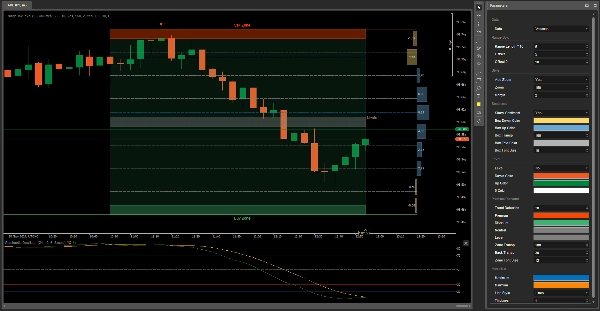
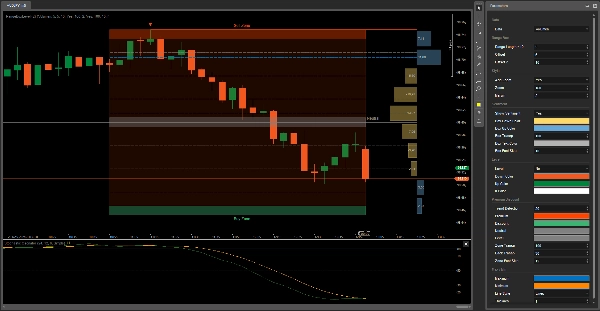
ขึ้นอยู่กับแนวโน้มของสินทรัพย์ พื้นหลังของกล่องช่วงจะเปลี่ยนเป็นสีเขียวถ้าเป็นขาขึ้น และสีแดงถ้าเป็นขาลง
สูงสุด / ต่ำสุด
นี่คือเส้นสีน้ำเงินและสีเหลืองที่เปลี่ยนตำแหน่งตามการทำนายว่าราคาจะไปที่ใด กล่องช่วงถูกแบ่งออกเป็น 9 ส่วนเพื่อช่วยกำหนดจุดกลับตัวของราคา ทำหน้าที่เป็น Fibonacci Retracement
คุณจะเป็นอมตะ
โชคดี 😀
สรุป
Key features include sentiment visualization with bars indicating the dominance of buyers or sellers, trend detection through background color changes (green for bullish, red for bearish), and level indicators that display potential price and pip targets for placing orders. The Range Box is divided into nine sections to identify price inflection points, functioning similarly to Fibonacci retracement levels, with dynamic max/min lines predicting possible price movements.
This tool supports analysis across various markets including stocks, cryptocurrencies, indices like NAS100, and commodities such as XAUUSD (gold). It is suitable for trading strategies like scalping and grid trading and can assist traders in anticipating price movements and making informed decisions. The indicator integrates with additional tools for enhanced order price management and market session analysis.
รีวิวจากลูกค้า
5 | 100 % | |
4 | 0 % | |
3 | 0 % | |
2 | 0 % | |
1 | 0 % |


!["Wyckoff Toolkit [Iridio Capital]" โลโก้](https://cdn.ctrader.com/image/webp/8acfe6a1-6a8e-4578-9367-9df3af2b1801_27763)


