
คำอธิบาย
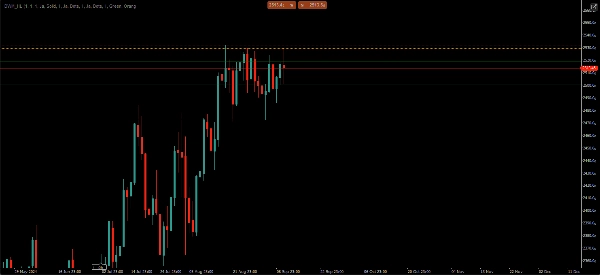
ระดับสภาพคล่อง NGS – สูงสุด & ต่ำสุด รายวัน • รายสัปดาห์ • รายเดือน
เทรดรอบสภาพคล่อง ไม่ใช่รอบเส้นสุ่ม
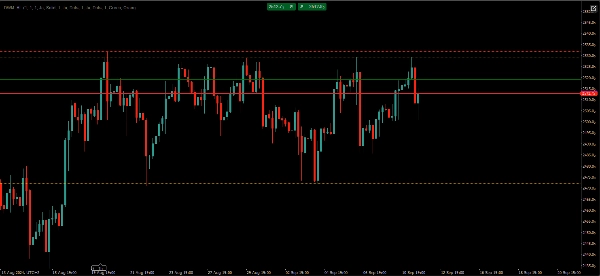
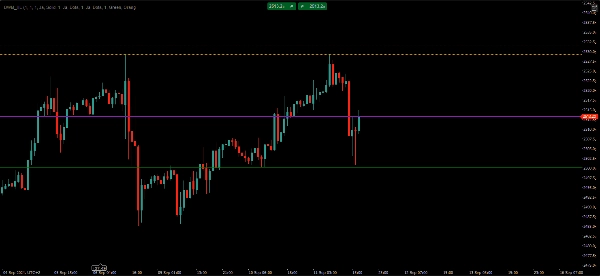
ระดับสภาพคล่อง NGS แสดงระดับสภาพคล่องรายวัน รายสัปดาห์ และรายเดือนที่สำคัญที่สุดโดยอัตโนมัติบนทุกแผนภูมิ
• ไม่ต้องวาดด้วยมือ
• ไม่ต้องเปลี่ยนกรอบเวลา
• ไม่มีความยุ่งเหยิงบนแผนภูมิ
ตัวบ่งชี้ที่ใช้งานง่ายนี้ช่วยให้เทรดเดอร์ระบุระดับสภาพคล่องและโครงสร้างตลาดที่สำคัญได้ภายในไม่กี่วินาที แทนที่จะต้องทำเครื่องหมายสูงสุดและต่ำสุดด้วยมือทุกวัน ระดับที่สำคัญที่สุดจะแสดงและอัปเดตโดยอัตโนมัติสำหรับคุณ
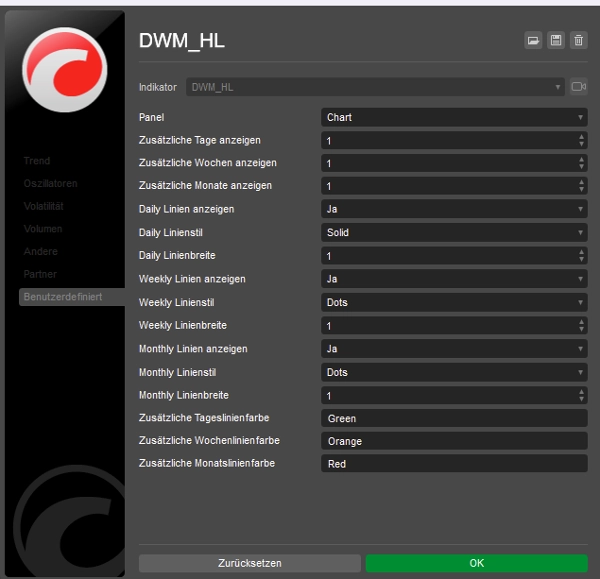
คุณสมบัติ:
• ระดับสูงสุด & ต่ำสุดรายวันอัตโนมัติ
• ระดับสูงสุด & ต่ำสุดรายสัปดาห์อัตโนมัติ
• ระดับสูงสุด & ต่ำสุดรายเดือนอัตโนมัติ
• ตัวเลือกแสดงระดับช่วงเวลาก่อนหน้า
• สีและสไตล์เส้นปรับแต่งได้
• การแสดงผลแผนภูมิที่สะอาดและน้ำหนักเบา
• ใช้งานได้กับ Forex, ดัชนี, สินค้าโภคภัณฑ์ และคริปโต
• รองรับหลายกรอบเวลา
• ไม่ทับซ้อนข้อมูลใหม่
ออกแบบมาสำหรับเทรดเดอร์ที่เน้นโครงสร้างตลาด สภาพคล่อง และระดับกรอบเวลาที่สูงกว่า
ไม่มีสัญญาณ
ไม่มีกลยุทธ์
ไม่มีคำสัญญากำไร
เพียงระดับสภาพคล่องที่เป็นวัตถุประสงค์และกระบวนการเทรดที่สะอาดขึ้น
สรุป
รีวิวจากลูกค้า
5 | 100 % | |
4 | 0 % | |
3 | 0 % | |
2 | 0 % | |
1 | 0 % |


