
RT VWAP
อินดิเคเตอร์
2 การซื้อ
เวอร์ชัน 1.0, Sep 2024
Windows, Mac
คำอธิบาย
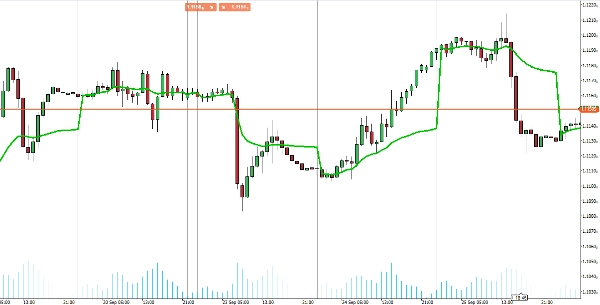
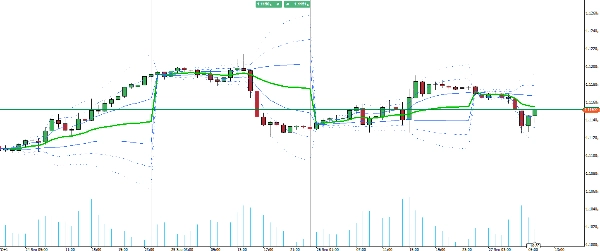
แนะนำ VWAP ตัวบ่งชี้สำหรับ cTrader ที่นำฟังก์ชันการทำงานเต็มรูปแบบของ Volume Weighted Average Price ของ TradingView มาสู่แพลตฟอร์มการซื้อขายของคุณ
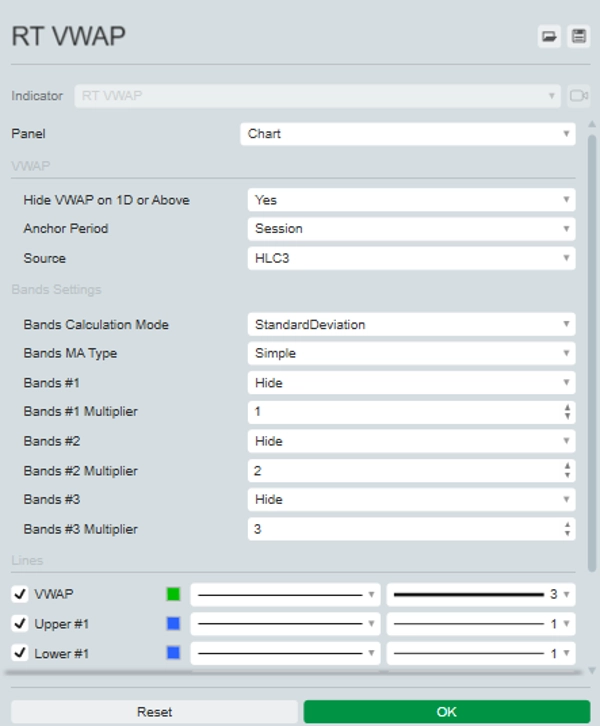
เครื่องมือที่ครอบคลุมนี้ช่วยให้คุณเลือกช่วงเวลาหลัก (Session, Week, Month, Quarter, Year) และเลือกจากแหล่งราคาต่างๆ รวมถึง Open, High, Low, Close, HL2, HLC3, OHLC4 และ HLCC4 นอกจากนี้ยังสามารถแสดงแถบส่วนเบี่ยงเบนมาตรฐานบนและล่างได้สูงสุดสามแถบ เพื่อให้มุมมองที่ครบถ้วนของการกระจายราคา
ตัวบ่งชี้ VWAP อัปเดตแบบเรียลไทม์ด้วยข้อมูล tick เพื่อให้แน่ใจว่าคุณมีข้อมูลเชิงลึกที่ถูกต้องและทันเวลาที่สุดสำหรับการตัดสินใจซื้อขายของคุณ ยกระดับกลยุทธ์การซื้อขายของคุณด้วยตัวบ่งชี้ VWAP ที่หลากหลายและทรงพลังใน cTrader
สรุป
โปรไฟล์อินดิเคเตอร์
รีวิวจากลูกค้า
0.0
รีวิว: 0
รีวิวจากลูกค้า
ยังไม่มีรีวิวสำหรับผลิตภัณฑ์นี้ หากเคยลองแล้ว ขอเชิญมาเป็นคนแรกที่บอกคนอื่น!
การสนทนา
คำถามที่พบบ่อย
BTCUSD
Forex
Indices
EURUSD
Commodities
GBPUSD
NZDUSD
Scalping
Crypto
Stocks
XAUUSD
NAS100
USDJPY
VWAP
ผลิตภัณฑ์ที่มีให้บริการผ่าน cTrader Store รวมถึงบอทการเทรด อินดิเคเตอร์ และปลั๊กอิน มีให้บริการโดยนักพัฒนาบุคคลที่สามและมีไว้เพื่อวัตถุประสงค์ในการเข้าถึงข้อมูลและทางเทคนิคเท่านั้น cTrader Store ไม่ใช่โบรกเกอร์และไม่ได้ให้คำแนะนำการลงทุน คำแนะนำส่วนบุคคล หรือการรับประกันผลการดำเนินงานในอนาคต


!["[Hamster-Coder] Moving Average MTF" โลโก้](https://cdn.ctrader.com/image/webp/b11b98b1-194d-4b8e-b00e-d611826ad159_31226)


ราคา
ตั้งแต่ 25/09/2024
20
การขาย