
คำอธิบาย
TREND ANALYSIS เป็นตัวบ่งชี้ทางเทคนิคขั้นสูงสำหรับแพลตฟอร์ม cTrader ที่รวมวิธีการวิเคราะห์หลายแบบไว้ในโซลูชันเดียว พัฒนาขึ้นสำหรับเทรดเดอร์ที่ต้องการยืนยันแนวโน้มผ่านการรวมตัวของตัวบ่งชี้ มันนำเสนอภาพรวมตลาดที่ครบถ้วนพร้อมสัญญาณที่แม่นยำและตัวกรองการตรวจสอบ
ดูวิดีโอแนะนำเกี่ยวกับกลยุทธ์การดำเนินงาน!
🎯 กลยุทธ์การใช้งาน
1. การเทรดตามแนวโน้ม
การประยุกต์ใช้: ระบุและติดตามแนวโน้มที่มีอยู่
กรอบเวลา: H4, D1 สำหรับตำแหน่งระยะยาว
การตั้งค่า: ADX > 25, ปริมาณสูงกว่าค่าเฉลี่ย
การจัดการความเสี่ยง: ตั้งจุดหยุดขาดทุนต่ำกว่าค่าเฉลี่ยเคลื่อนที่ 50 ช่วงเวลา
2. การเทรดสวิง
การประยุกต์ใช้: จับการเคลื่อนไหวระยะกลาง
กรอบเวลา: H1, H4
การตั้งค่า: เปิดใช้งานตัวกรองปริมาณ, ยืนยันโดย Volume Profile
เป้าหมาย: Volume Profile POC เป็น TP
3. การเทรดเบรกเอาต์
การประยุกต์ใช้: เข้าตลาดเมื่อเกิดการเบรกเอาต์ของแนวรับ/แนวต้าน
การตั้งค่า: ปริมาณ PVA เพื่อยืนยันความแข็งแกร่งของการเคลื่อนไหว
การยืนยัน: ADX เพิ่มขึ้น + ปริมาณสูงกว่าค่าเฉลี่ย
4. การสแคปปิ้ง (กรอบเวลาสั้นกว่า)
การประยุกต์ใช้: การเทรดรวดเร็วพร้อมการยืนยันหลายครั้ง
กรอบเวลา: M1, M5
การตั้งค่า: ตัวกรองปริมาณเข้มงวดและโมเมนตัม
🔧 วิธีการทำงานของตัวบ่งชี้
CORE ADX & DI
ADX (Average Directional Index)
ฟังก์ชัน: วัดความแข็งแกร่งของแนวโน้ม
การตีความ:
0-25: แนวโน้มอ่อน/เคลื่อนไหวด้านข้าง
25-50: แนวโน้มแข็งแรง
50+: แนวโน้มแข็งแรงมาก
การใช้งานจริง: หลีกเลี่ยงการเทรดเมื่อ ADX < 20
+DI / -DI (ตัวบ่งชี้ทิศทาง)
+DI: ความแข็งแกร่งของผู้ซื้อ
-DI: ความแข็งแกร่งของผู้ขาย
สัญญาณ: การตัดกันของ +DI เหนือ -DI (ซื้อ) และในทางกลับกัน
ADX Slope (ความชันของ ADX)
ฟังก์ชัน: วัดความเร่งของแนวโน้ม
การแสดงผล: ฮิสโตแกรมสีฟ้าอมเขียว
สัญญาณ: ค่าบวกบ่งชี้แนวโน้มที่แข็งแกร่งขึ้น
ตัวกรองปริมาณ
ตัวกรอง MA ปริมาณ
ฟังก์ชัน: ตรวจสอบสัญญาณด้วยปริมาณที่สูงกว่าค่าเฉลี่ย
พารามิเตอร์: ช่วงเวลา 20, ตัวคูณ 1.0
การใช้งาน: ยืนยันความสนใจของสถาบัน
Volume PVA (การวิเคราะห์ราคาและปริมาณ)
สีและความหมาย:
สีเขียว: ซื้อด้วยปริมาณสูงมาก (>150% ค่าเฉลี่ย)
สีน้ำเงิน: ซื้อด้วยปริมาณสูง
สีแดง: ขายด้วยปริมาณสูงมาก
สีชมพู: ขายด้วยปริมาณสูง
สีเหลือง: Pin Bar/การหมดแรงพร้อมการเบรกแนวรับ
โปรไฟล์ปริมาณ
POC (จุดควบคุม)
ฟังก์ชัน: ราคาที่มีปริมาณการซื้อขายสูงสุด
การใช้งาน: เป้าหมายธรรมชาติสำหรับการเทรด, แนวรับ/แนวต้านแบบไดนามิก
พื้นที่ค่า
ฟังก์ชัน: โซนที่มีการซื้อขายปริมาณ 70%
การตีความ:
ราคาสูงกว่า: แนวโน้มขาขึ้น
ราคาต่ำกว่า: แนวโน้มขาลง
ภายใน: อาจเคลื่อนไหวด้านข้าง
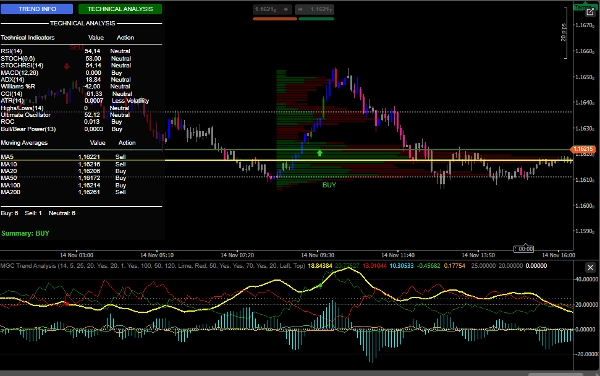
การวิเคราะห์ทางเทคนิคครบถ้วน
แผงตัวบ่งชี้
RSI: ซื้อมากเกินไป (<30) / ขายมากเกินไป (>70)
MACD: โมเมนตัม
Williams %R: สภาวะสุดขีด
CCI: การระบุการกลับตัว
Stochastic: โมเมนตัมระยะสั้น
Ultimate Oscillator: โมเมนตัมหลายกรอบเวลา
ค่าเฉลี่ยเคลื่อนที่
ชุดเต็มของ MA (5, 10, 20, 50, 100, 200)
การวิเคราะห์การจัดแนวสำหรับแนวโน้ม
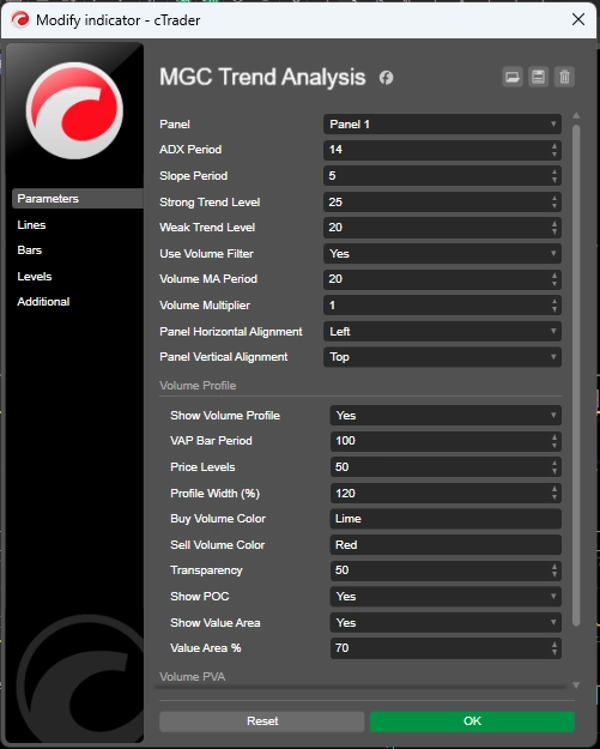
⚙️ การตั้งค่าที่แนะนำ
การตั้งค่ารักษา
javascript
ช่วงเวลา ADX: 14
ช่วงเวลา Slope: 5
ระดับแนวโน้มแข็งแรง: 25
ระดับแนวโน้มอ่อน: 20
ใช้ตัวกรองปริมาณ: true
ช่วงเวลา MA ปริมาณ: 20
ตัวคูณปริมาณ: 1.2
การตั้งค่ารุนแรง
javascript
ช่วงเวลา ADX: 10
ช่วงเวลา Slope: 3
ระดับแนวโน้มแข็งแรง: 20
ระดับแนวโน้มอ่อน: 15
ใช้ตัวกรองปริมาณ: true
ช่วงเวลา MA ปริมาณ: 14
ตัวคูณปริมาณ: 1.0
โปรไฟล์ปริมาณ (แนะนำ)
javascript
แสดงโปรไฟล์ปริมาณ: true
ช่วงเวลา VAP Bar: 100
ระดับราคา: 50
เปอร์เซ็นต์พื้นที่ค่า: 70
แสดง POC: true
🎨 ทรัพยากรภาพ
ส่วนติดต่อผู้ใช้
แผงไดนามิก: ข้อมูลเรียลไทม์
ปุ่มโต้ตอบ: สลับระหว่างการวิเคราะห์
สีที่เข้าใจง่าย: รหัสตามฟังก์ชัน
สัญญาณกราฟิก
ลูกศร: จุดเข้า BUY/SELL
เสียง: การแจ้งเตือนที่ได้ยิน
สีแท่ง: การวิเคราะห์ PVA แบบบูรณาการ
สรุป
รีวิวจากลูกค้า
5 | 67 % | |
4 | 33 % | |
3 | 0 % | |
2 | 0 % | |
1 | 0 % |


!["Gaussian Channel [Iridio Capital]" โลโก้](https://cdn.ctrader.com/image/webp/7c039209-5573-4a54-a072-f9528b503103_41960)


