
RT MACD
Gösterge
5 satın almalar
Sürüm 1.0, Sep 2024
Windows, Mac
Açıklama
Kişiselleştirilebilir klasik MACD göstergesini tanıtıyoruz; kişiselleştirilmiş özelliklerle ticaret deneyiminizi geliştirmek için tasarlandı.
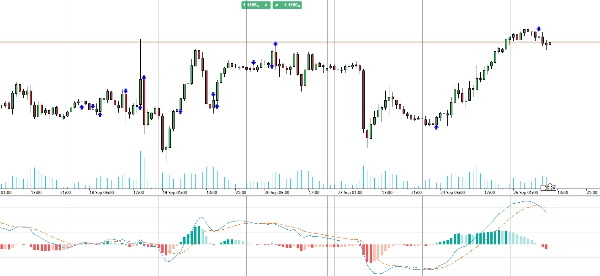
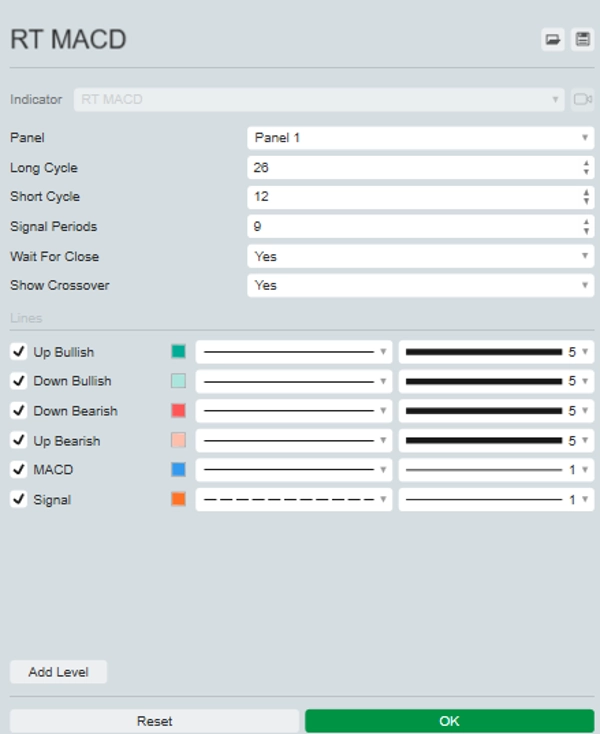
Geleneksel MACD'nin bu yükseltilmiş versiyonu, grafik görselleştirmesini daha net hale getirmek için çizgi ve histogram renklerini özelleştirmenize olanak tanır. İsteğe bağlı olarak, mum kapanışı yerine tick verilerini kullanarak gerçek zamanlı güncellenebilir ve hızlı piyasalarda zamanında içgörüler sağlar.
Ayrıca, potansiyel alım ve satım sinyallerini tespit etmeyi kolaylaştırmak için kesişim noktalarını doğrudan grafikte vurgular.
Daha iyi doğruluk ve karar verme için kişiselleştirilebilir klasik MACD göstergesiyle ticaret stratejinizi geliştirin.
Özet
Gösterge profili
Müşteri değerlendirmeleri
0.0
Değerlendirmeler: 0
Müşteri değerlendirmeleri
Bu ürün için henüz bir değerlendirme yok. Ürünü denediniz mi? O zaman ona dair görüşlerini paylaşan ilk kişi olun!
Tartışma
SSS
BTCUSD
Forex
Signal
Indices
EURUSD
Commodities
GBPUSD
NZDUSD
Prop
Scalping
Crypto
Stocks
XAUUSD
NAS100
MACD
USDJPY
cTrader Store üzerinden erişilebilen işlem botları, göstergeler ve eklentiler gibi ürünler, üçüncü taraf sağlayıcılar tarafından sağlanır ve yalnızca bilgilendirme ve teknik erişim amaçlarıyla sunulur. cTrader Store bir broker değildir ve yatırım tavsiyesi, kişisel öneriler vermez veya gelecekteki performansı garanti etmez.


Fiyat
Başlangıç 25/09/2024
20
Satışlar