
Opis
Wskaźnik BLOCK LIQUIDITY łączy dwa główne podejścia do analizy rynku:
Wykrywanie bloków zleceń:
Identyfikuje obszary wsparcia i oporu na podstawie nieprzerwanych maksimów i minimów w okresie analizy wstecznej.
Generuje sygnały kupna, gdy cena zamyka się powyżej nieprzerwanego minimum.
Generuje sygnały sprzedaży, gdy cena zamyka się poniżej nieprzerwanego maksimum.
Analiza płynności:
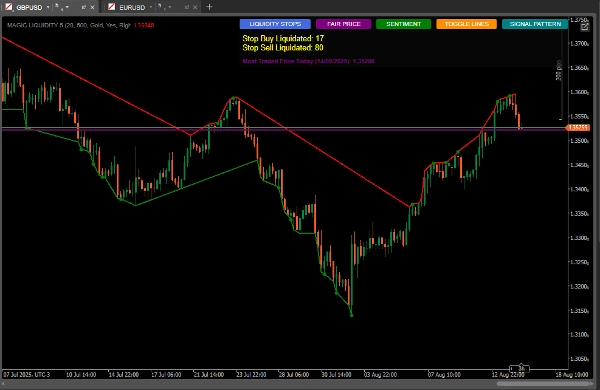
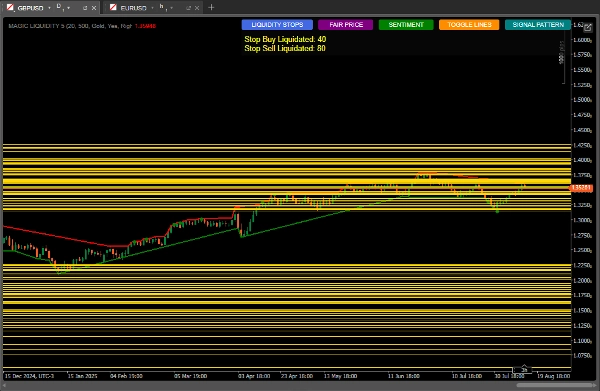
Wykrywa pule płynności (obszary, gdzie mogą być skoncentrowane zlecenia stop loss).
Monitoruje aktywację zleceń stop kupna i sprzedaży.
Oblicza sentyment rynku na podstawie rozkładu płynności.
Identyfikuje najczęściej handlowaną cenę (cenę uczciwą).
Jak używać dla najlepszych rezultatów
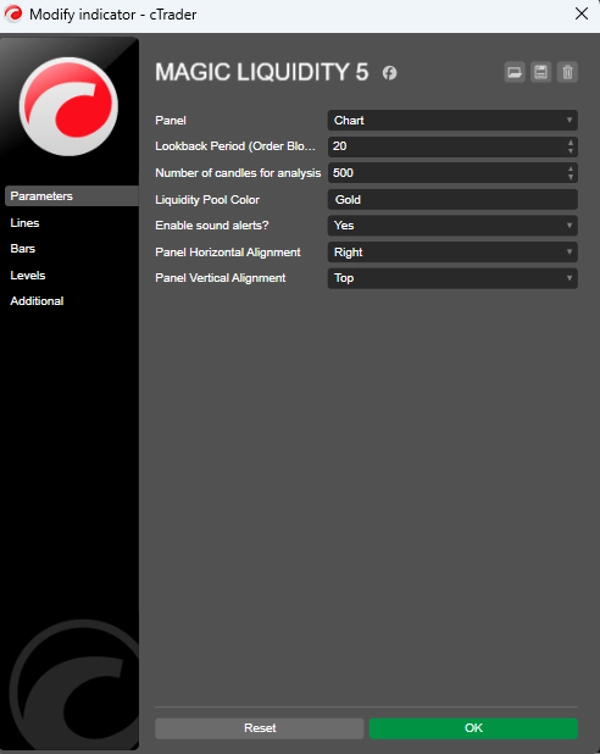
Konfiguracja początkowa
Okres analizy wstecznej: Dostosuj parametr "Lookback Period" do ram czasowych, na których handlujesz (wyższe wartości dla wyższych ram czasowych).
Liczba świec do analizy: Utrzymuj na poziomie 500 dla solidnej analizy lub zmniejsz, aby uzyskać szybsze reakcje.
Kolor puli płynności: Wybierz kolor, który wyróżnia się na Twoim wykresie.
Interpretacja sygnałów
Sygnały bloków zleceń:
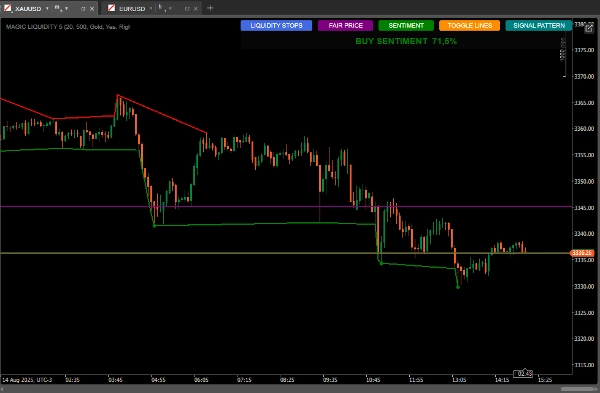
Zielone kropki: sygnały kupna, gdy cena zamyka się powyżej niepokonanego minimum.
Czerwone kropki: sygnały sprzedaży, gdy cena zamyka się poniżej niepokonanego maksimum.
Pule płynności:
Linie poziome pokazują obszary płynności (potencjalne cele lub punkty odwrócenia).
Monitoruj relację między płynnością powyżej/poniżej bieżącej ceny.
Sentyment rynku:
Użyj przycisku "SENTIMENT", aby zobaczyć dominujący kierunek i pewność.
Sentyment kupna z wysoką pewnością sugeruje kontynuację wzrostu. Sentyment sprzedaży z wysoką pewnością sugeruje kontynuację trendu spadkowego.
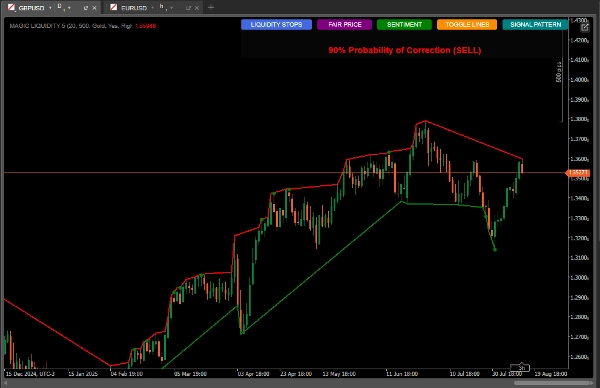
Formacje świecowe:
Przycisk "SIGNAL PATTERN" analizuje i
Pokazuje prawdopodobieństwa korekty na podstawie stosunku ilościowego
Najczęściej handlowana cena (cena uczciwa):
Przycisk "FAIR PRICE" pokazuje poziom cenowy z najwyższym wolumenem dnia.
Może działać jak magnes dla cen lub jako wsparcie/opór.
Strategie użytkowania
Strategia konserwatywna:
Handluj tylko wtedy, gdy sygnały bloków zleceń pokrywają się z dominującym sentymentem.
Używaj puli płynności jako celów realizacji zysków.
Strategia agresywna:
Przewiduj odwrócenia, gdy cena zbliża się do puli płynności z wieloma zgromadzonymi zleceniami stop.
Wykorzystuj dywergencje między sentymentem a działaniem ceny do transakcji przeciwtrendowych.
Dodatkowe potwierdzenie:
Porównaj z formacją świecową pokazaną przez wskaźnik.
Sprawdź, czy cena uczciwa jest w pobliżu jako obszar zainteresowania.
Zarządzanie ryzykiem.
Stop-Loss:
Umieść poniżej najnowszego bloku zleceń dla pozycji kupna
Umieść powyżej najnowszego bloku zleceń dla pozycji sprzedaży
Take-Profit:
Cele w pobliskich pulach płynności
Uwzględnij stosunek płynności powyżej/poniżej, aby ustawić cele
Zaawansowane wskazówki
Użyj przycisku "TOGGLE LINES", aby wyłączyć linie płynności, gdy wykres staje się zagracony
Monitoruj liczbę zlikwidowanych zleceń stop, aby ocenić siłę ruchu
Cena uczciwa jest szczególnie przydatna na rynkach ograniczonych zakresowo, takich jak dynamiczne wsparcie/opór
Łącz z innymi wskaźnikami dla potwierdzenia (wolumen, średnie kroczące)
Wolumen wskaźnika:
https://ctrader.com/pt/products/635
Podsumowanie
Users can customize parameters such as lookback period and number of candles analyzed to suit different timeframes and trading styles. Visual signals include green and red dots for buy and sell order block signals, and horizontal lines marking liquidity pools. Additional features include sentiment indication with confidence levels, candlestick pattern analysis for correction probabilities, and toggling of liquidity lines for chart clarity.
Recommended strategies include trading in the direction of order block signals aligned with sentiment for conservative approaches, or anticipating reversals near liquidity pools for aggressive trades. Risk management is supported by placing stop-loss orders relative to recent order blocks and setting take-profit targets at liquidity pools. The indicator can be combined with other tools like volume and moving averages for confirmation.
Opinie klientów
5 | 100 % | |
4 | 0 % | |
3 | 0 % | |
2 | 0 % | |
1 | 0 % |


