
الوصف
دلتا الحجم التراكمية النسبية الكلاسيكية (مثبتة)
افتح النية الحقيقية لمشاركي السوق مع دلتا الحجم التراكمية النسبية الكلاسيكية. على عكس مؤشرات دلتا الحجم التراكمية القياسية التي تجمع ببساطة حجم التيك، يستخدم هذا الأداة المنطق النسبي لوزن الحجم بناءً على حركة السعر الفعلية داخل كل شريط.
لماذا دلتا "نسبية"؟
يمكن أن تكون دلتا الحجم التراكمية القياسية مضللة. يحسب هذا المؤشر الدلتا من خلال تحليل العلاقة بين نطاق الشمعة (الأعلى-الأدنى) والمسافة بين الإغلاق والفتح. هذا يضمن توزيع الحجم بشكل واقعي:
- شموع الاقتناع القوي (الإغلاق بالقرب من الأعلى/الأدنى) تساهم أكثر في الدلتا.
- شموع ذات فتائل ثقيلة (علامات على الامتصاص أو الرفض) تعادل الدلتا، مما يمنع إشارات الحجم "الوهمية".
الميزات الرئيسية
- ⚓ التثبيت الذكي (إعادة تعيين متعددة الأطر الزمنية): حافظ على تحليلك مرتبطًا بجلسة التداول الحالية. اختر إعادة تعيين الحساب يوميًا، أسبوعيًا، أو شهريًا—أو اتركه يعمل بلا حدود.
- 📊 عرضان بصريان:
-
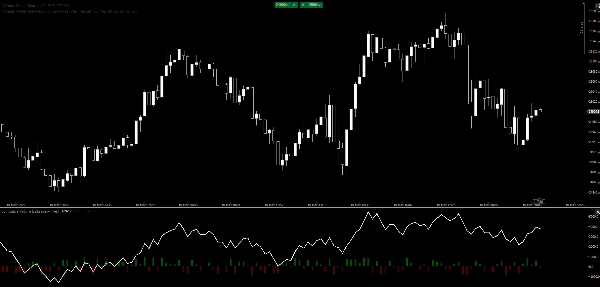
- خط دلتا الحجم التراكمية: خط نظيف وعالي الأداء لرصد التباينات طويلة الأمد ونفاد الاتجاه.
- تراكب المدرج التكراري: رد فعل بصري فوري على ضغط الشراء/البيع لكل شريط لتحديد الذروة أو الامتصاص بنظرة سريعة.
- ⚡ خفيف جدًا: مكتوب بتحسين أصلي بلغة C# لـ cTrader، مما يضمن عدم وجود تأخير حتى على الأجهزة الضعيفة أو الأسواق المتقلبة.
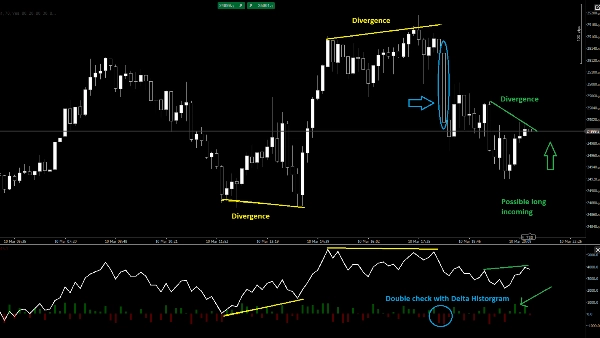
- 🎯 رصد التباينات: تعرف بسهولة متى يصنع السعر قممًا جديدة بينما يفشل دلتا الحجم التراكمية—علامة كلاسيكية على التوزيع المؤسسي.
كيفية التداول به
- تأكيد الاتجاه: ابحث عن اتجاه خط دلتا الحجم التراكمية في نفس اتجاه السعر.
- الامتصاص: عندما يصل السعر إلى أدنى جديد لكن المدرج التكراري لدلتا الحجم التراكمية يظهر "دلتا صاعدة" قوية (باللون الأخضر)، يكون المشترون يمتصون ضغط البيع.
- نفاد القوة: راقب ارتفاعًا حادًا في المدرج التكراري (الذروة) يتبعه انعكاس في خط دلتا الحجم التراكمية.
المعلمات:
- وضع التثبيت: أبدًا، يوميًا، أسبوعيًا، شهريًا.
- عرض دلتا الشريط: تبديل المدرج التكراري تشغيل/إيقاف.
افتح النية الحقيقية لمشاركي السوق مع دلتا الحجم التراكمية النسبية الكلاسيكية. على عكس مؤشرات دلتا الحجم التراكمية القياسية التي تجمع ببساطة حجم التيك، يستخدم هذا الأداة المنطق النسبي لوزن الحجم بناءً على حركة السعر الفعلية داخل كل شريط.
لماذا دلتا "نسبية"؟
يمكن أن تكون دلتا الحجم التراكمية القياسية مضللة. يحسب هذا المؤشر الدلتا من خلال تحليل العلاقة بين نطاق الشمعة (الأعلى-الأدنى) والمسافة بين الإغلاق والفتح. هذا يضمن توزيع الحجم بشكل واقعي:
- شموع الاقتناع القوي (الإغلاق بالقرب من الأعلى/الأدنى) تساهم أكثر في الدلتا.
- شموع ذات فتائل ثقيلة (علامات على الامتصاص أو الرفض) تعادل الدلتا، مما يمنع إشارات الحجم "الوهمية".
الميزات الرئيسية
- ⚓ التثبيت الذكي (إعادة تعيين متعددة الأطر الزمنية): حافظ على تحليلك مرتبطًا بجلسة التداول الحالية. اختر إعادة تعيين الحساب يوميًا، أسبوعيًا، أو شهريًا—أو اتركه يعمل بلا حدود.
- 📊 عرضان بصريان:
-
- خط دلتا الحجم التراكمية: خط نظيف وعالي الأداء لرصد التباينات طويلة الأمد ونفاد الاتجاه.
- تراكب المدرج التكراري: رد فعل بصري فوري على ضغط الشراء/البيع لكل شريط لتحديد الذروة أو الامتصاص بنظرة سريعة.
- ⚡ خفيف جدًا: مكتوب بتحسين أصلي بلغة C# لـ cTrader، مما يضمن عدم وجود تأخير حتى على الأجهزة الضعيفة أو الأسواق المتقلبة.
- 🎯 رصد التباينات: تعرف بسهولة متى يصنع السعر قممًا جديدة بينما يفشل دلتا الحجم التراكمية—علامة كلاسيكية على التوزيع المؤسسي.
كيفية التداول به
- تأكيد الاتجاه: ابحث عن اتجاه خط دلتا الحجم التراكمية في نفس اتجاه السعر.
- الامتصاص: عندما يصل السعر إلى أدنى جديد لكن المدرج التكراري لدلتا الحجم التراكمية يظهر "دلتا صاعدة" قوية (باللون الأخضر)، يكون المشترون يمتصون ضغط البيع.
- نفاد القوة: راقب ارتفاعًا حادًا في المدرج التكراري (الذروة) يتبعه انعكاس في خط دلتا الحجم التراكمية.
المعلمات:
- وضع التثبيت: أبدًا، يوميًا، أسبوعيًا، شهريًا.
- عرض دلتا الشريط: تبديل المدرج التكراري تشغيل/إيقاف.
الملخص
Key features include smart anchoring with multi-timeframe resets (daily, weekly, monthly, or continuous), dual visuals comprising a CVD line for spotting divergences and trend exhaustion, and a histogram overlay for immediate per-bar buying or selling pressure insights. The indicator is optimized in native C# for cTrader, ensuring high performance and low resource use.
Traders can use the indicator for trend confirmation by aligning CVD direction with price, identify absorption when price lows coincide with strong positive delta in the histogram, and detect exhaustion through histogram spikes followed by CVD reversals. Adjustable parameters include anchor mode and histogram display toggle.
This tool supports analysis across multiple markets and symbols, including Forex, cryptocurrencies, indices, commodities, and stocks.
تقييمات العملاء
5 | 0 % | |
4 | 100 % | |
3 | 0 % | |
2 | 0 % | |
1 | 0 % |


![شعار "[CB] Pivot Points Pro"](https://cdn.ctrader.com/image/webp/43463c82-67b0-4f10-a4ba-901bba091d81_32594)


