
Description
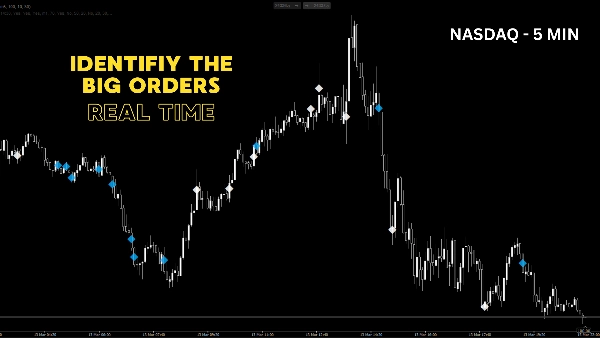
Clusters de volume anormaux est un outil d'analyse de volume haute précision pour cTrader conçu pour révéler les empreintes institutionnelles et l'activité de trading extrême. Le volume précède le prix, et cet indicateur vous montre exactement où "l'argent intelligent" entre sur le marché.
Au lieu de s'appuyer sur des seuils de volume fixes et statiques, cet indicateur utilise une logique dynamique de percentile glissant. Il analyse l'historique récent et ne met en évidence que les chandeliers dont le volume est vraiment anormal (par exemple, les 5 % des barres de volume les plus élevées sur les 200 dernières périodes).
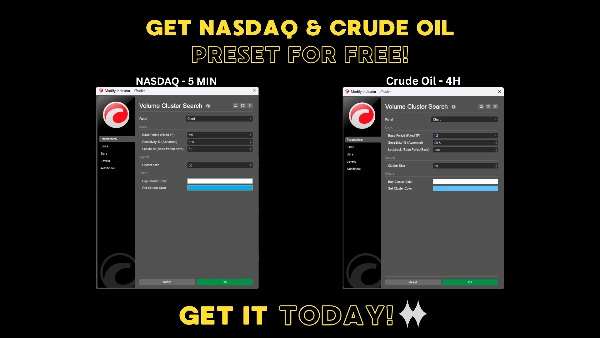
Un avantage majeur est sa capacité Multi-Timeframe (MTF) : vous pouvez trader sur un graphique de 5 minutes tandis que l'indicateur surveille discrètement une "Période de Base" supérieure (comme le graphique horaire) pour détecter les pics de volume, projetant ces clusters cruciaux directement sur votre graphique de timeframe inférieur exactement là où ils se sont produits.
🔥 Fonctionnalités clés :
- Sensibilité dynamique : Utilise un seuil de percentile glissant (par exemple, 95 %) pour s'adapter automatiquement aux conditions de marché calmes comme très volatiles.
- Véritable Multi-Timeframe : Filtre le bruit du marché en utilisant un timeframe de base supérieur, tout en gardant vos entrées parfaitement précises sur des timeframes inférieurs.
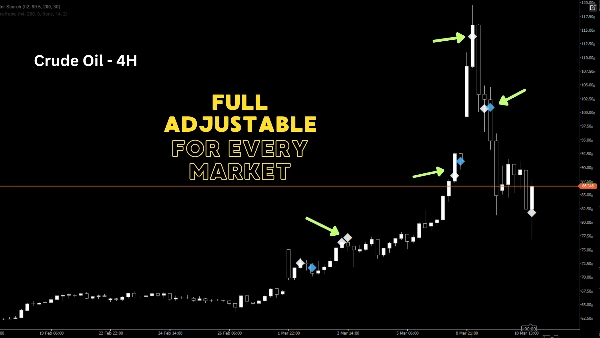
- Clusters directionnels : Les événements de volume extrême sont affichés sous forme de marqueurs en forme de diamant (◆) juste au niveau du prix médian. Vert pour les clôtures haussières, Rouge pour les clôtures baissières.
- Hautement optimisé : La gestion de mémoire intégrée (maximum 2000 objets dessinés) garantit que votre plateforme cTrader reste ultra rapide.
- Entièrement personnalisable : Ajustez la période de retour, la sensibilité (%), le timeframe de base, la taille des clusters et les couleurs pour correspondre à votre style de trading personnel.
💡 Comment l'utiliser ?
Un volume anormal indique généralement l'une des deux choses : un démarrage massif de tendance (ruptures) ou une capitulation/absorption (renversements). En repérant ces clusters, vous pouvez identifier des zones cachées de support et de résistance basées sur le capital réellement échangé, pas seulement sur l'action des prix. Parfait pour les Day Traders, Scalpers, Swing Traders et les traders axés sur le volume cherchant un véritable avantage.
Résumé
Avis clients
5 | 0 % | |
4 | 67 % | |
3 | 33 % | |
2 | 0 % | |
1 | 0 % |


