
Description
CVD Proportionnel Classique (Ancré)
Déverrouillez la véritable intention des participants au marché avec le CVD Proportionnel Classique. Contrairement aux indicateurs standard de Delta de Volume Cumulé qui se contentent d'additionner le volume des ticks, cet outil utilise une Logique Proportionnelle pour pondérer le volume en fonction de l'action réelle des prix dans chaque barre.
Pourquoi un delta "Proportionnel" ?
Le CVD standard peut être trompeur. Cet indicateur calcule le delta en analysant la relation entre la plage de la barre (Haut-Bas) et la distance entre la clôture et l'ouverture. Cela garantit une distribution réaliste du volume :
- Bougies à forte conviction (clôturant près du haut/bas) contribuent davantage au delta.
- Bougies avec de longues mèches (signes d'absorption ou de rejet) neutralisent le delta, évitant les signaux de volume "faux".
Caractéristiques clés
- ⚓ Ancrage intelligent (Réinitialisation multi-échelles) : Gardez votre analyse pertinente pour la session de trading en cours. Choisissez de réinitialiser le calcul quotidiennement, hebdomadairement ou mensuellement — ou laissez-le fonctionner indéfiniment.
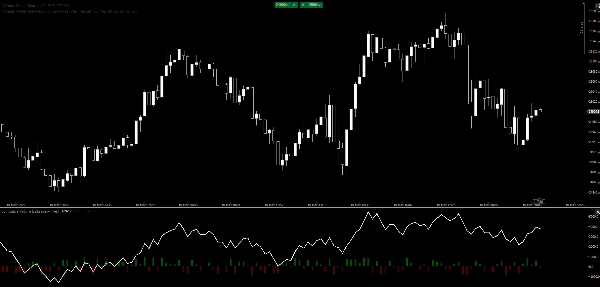
- 📊 Double affichage :
-
- La ligne CVD : Une ligne claire et performante pour repérer les divergences à long terme et l'épuisement de tendance.
- Superposition d'histogramme : Retour visuel instantané sur la pression d'achat/vente par barre pour identifier rapidement un climax ou une absorption.
- ⚡ Ultra-léger : Écrit avec une optimisation native en C# pour cTrader, garantissant zéro latence même sur des machines bas de gamme ou des marchés volatils.
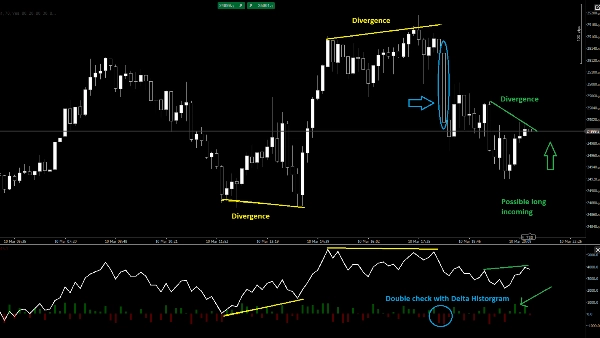
- 🎯 Détection de divergences : Identifiez facilement quand le prix atteint de nouveaux sommets alors que le CVD échoue — un signe classique de distribution institutionnelle.
Comment trader avec
- Confirmation de tendance : Recherchez une tendance de la ligne CVD dans la même direction que le prix.
- Absorption : Lorsque le prix atteint un nouveau plus bas mais que l'histogramme CVD montre un fort "Delta Up" (vert), les acheteurs absorbent la pression de vente.
- Épuisement : Surveillez un pic net dans l'histogramme (climax) suivi d'un renversement de la ligne CVD.
Paramètres :
- Mode d'ancrage : Jamais, Quotidien, Hebdomadaire, Mensuel.
- Afficher le delta de la barre : Activez ou désactivez l'histogramme.
Déverrouillez la véritable intention des participants au marché avec le CVD Proportionnel Classique. Contrairement aux indicateurs standard de Delta de Volume Cumulé qui se contentent d'additionner le volume des ticks, cet outil utilise une Logique Proportionnelle pour pondérer le volume en fonction de l'action réelle des prix dans chaque barre.
Pourquoi un delta "Proportionnel" ?
Le CVD standard peut être trompeur. Cet indicateur calcule le delta en analysant la relation entre la plage de la barre (Haut-Bas) et la distance entre la clôture et l'ouverture. Cela garantit une distribution réaliste du volume :
- Bougies à forte conviction (clôturant près du haut/bas) contribuent davantage au delta.
- Bougies avec de longues mèches (signes d'absorption ou de rejet) neutralisent le delta, évitant les signaux de volume "faux".
Caractéristiques clés
- ⚓ Ancrage intelligent (Réinitialisation multi-échelles) : Gardez votre analyse pertinente pour la session de trading en cours. Choisissez de réinitialiser le calcul quotidiennement, hebdomadairement ou mensuellement — ou laissez-le fonctionner indéfiniment.
- 📊 Double affichage :
-
- La ligne CVD : Une ligne claire et performante pour repérer les divergences à long terme et l'épuisement de tendance.
- Superposition d'histogramme : Retour visuel instantané sur la pression d'achat/vente par barre pour identifier rapidement un climax ou une absorption.
- ⚡ Ultra-léger : Écrit avec une optimisation native en C# pour cTrader, garantissant zéro latence même sur des machines bas de gamme ou des marchés volatils.
- 🎯 Détection de divergences : Identifiez facilement quand le prix atteint de nouveaux sommets alors que le CVD échoue — un signe classique de distribution institutionnelle.
Comment trader avec
- Confirmation de tendance : Recherchez une tendance de la ligne CVD dans la même direction que le prix.
- Absorption : Lorsque le prix atteint un nouveau plus bas mais que l'histogramme CVD montre un fort "Delta Up" (vert), les acheteurs absorbent la pression de vente.
- Épuisement : Surveillez un pic net dans l'histogramme (climax) suivi d'un renversement de la ligne CVD.
Paramètres :
- Mode d'ancrage : Jamais, Quotidien, Hebdomadaire, Mensuel.
- Afficher le delta de la barre : Activez ou désactivez l'histogramme.
Résumé
Key features include smart anchoring with multi-timeframe resets (daily, weekly, monthly, or continuous), dual visuals comprising a CVD line for spotting divergences and trend exhaustion, and a histogram overlay for immediate per-bar buying or selling pressure insights. The indicator is optimized in native C# for cTrader, ensuring high performance and low resource use.
Traders can use the indicator for trend confirmation by aligning CVD direction with price, identify absorption when price lows coincide with strong positive delta in the histogram, and detect exhaustion through histogram spikes followed by CVD reversals. Adjustable parameters include anchor mode and histogram display toggle.
This tool supports analysis across multiple markets and symbols, including Forex, cryptocurrencies, indices, commodities, and stocks.
Avis clients
5 | 0 % | |
4 | 100 % | |
3 | 0 % | |
2 | 0 % | |
1 | 0 % |


