
RSI Advanced
Indicateur
1 achats
Version 1.0, Apr 2026
Windows, Mac
5.0
Avis : 1

Description
L'indice de force relative (RSI) standard est l'un des indicateurs les plus populaires au monde, mais tracer une seule ligne en bas de votre graphique est une méthode de trading dépassée. Cela rend difficile la détection des véritables changements de momentum, de l'accélération et des phases de marché instables.
Le RSI Advanced réinvente complètement cet oscillateur classique. En introduisant une ligne de signal, un filtrage de la volatilité et une peinture intelligente du graphique, il transforme le RSI en un tableau de bord complet, tout-en-un, pour le suivi du momentum et des tendances.
Caractéristiques clés
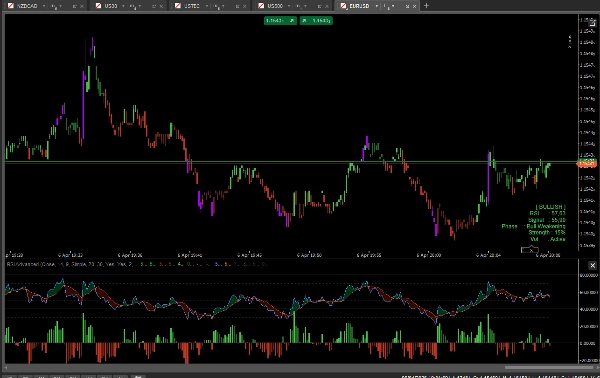
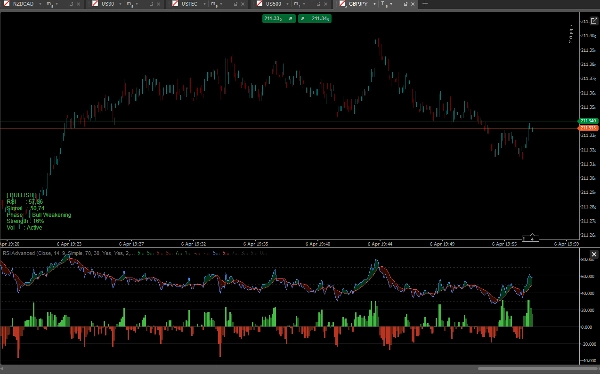
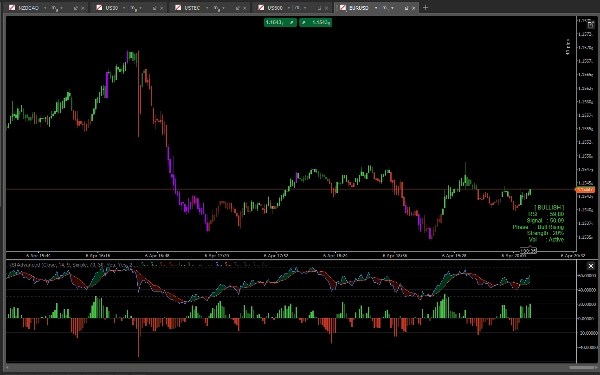
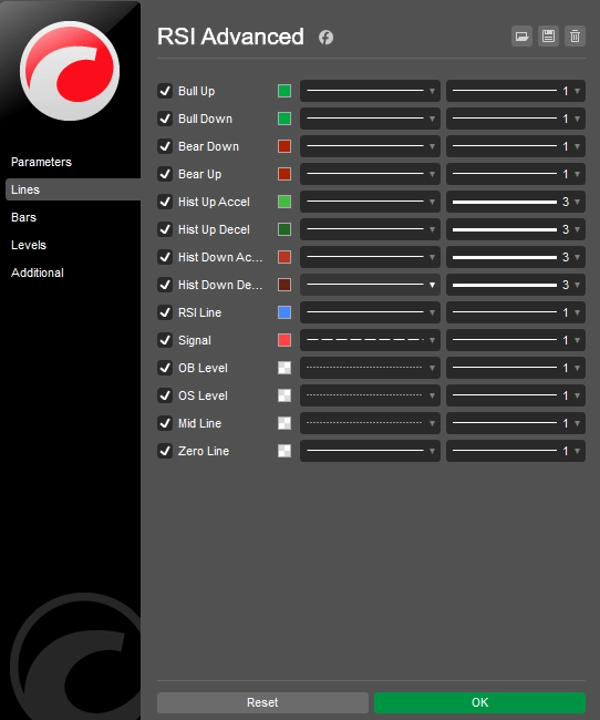
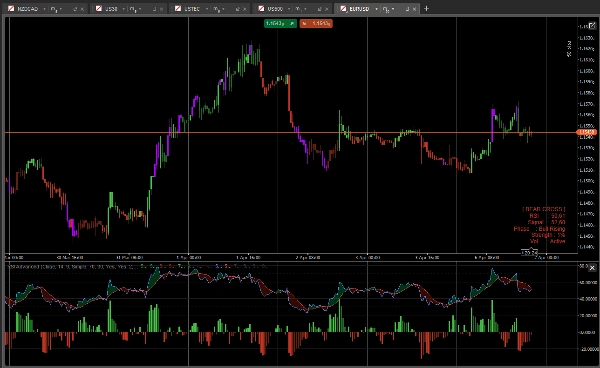
- RSI & Nuage de Signal : Nous avons ajouté une moyenne mobile (ligne de signal) au RSI. L'espace entre le RSI et sa ligne de signal est rempli d'un nuage dynamique. Si le nuage est vert, les haussiers dominent le momentum. S'il est rouge, les baissiers contrôlent.
- Histogramme de Momentum : Un histogramme centré suit la distance exacte entre le RSI et la ligne de signal. Avec des couleurs intégrées d'accélération/décélération (claires vs. foncées), vous pouvez anticiper les croisements et l'épuisement du momentum avant qu'ils ne se produisent.
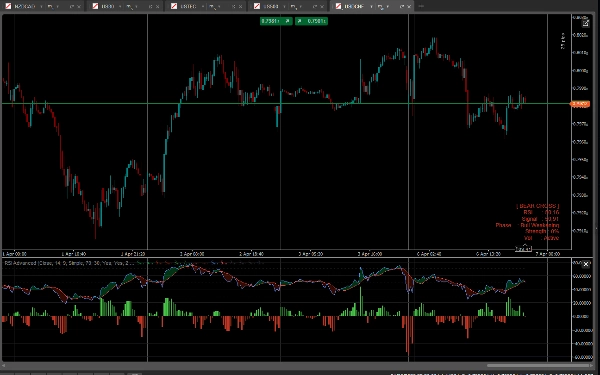
- Coloration Intelligente des Barres (Paintbars) : Vos chandeliers changeront de couleur en fonction du momentum RSI sous-jacent :
-
- Vert/Rouge vif : Forte concordance haussière/baissière (RSI > 50 et RSI > Signal).
- Vert/Rouge foncé : Momentum faible ou replis.
- Violet/Magenta : Niveaux extrêmes de surachat (OB) ou de survente (OS) – vous avertissant de potentielles inversions.
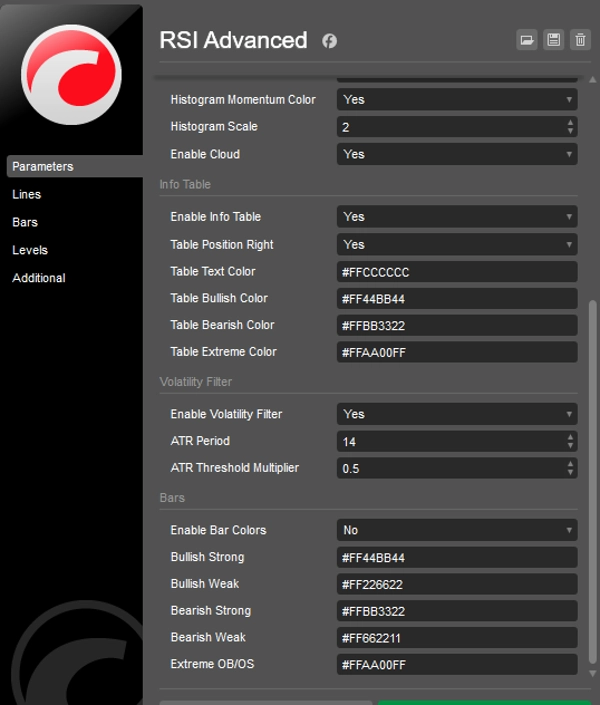
- Filtre de Volatilité Intelligent (ATR) : Marre d'être pris dans des marchés plats ? Activez le filtre ATR intégré. Lorsque la volatilité descend en dessous de votre moyenne historique, les chandeliers et l'histogramme deviennent gris, vous évitant ainsi de mauvaises transactions.
- Tableau de Bord d'Informations sur le Graphique : Un panneau de données élégant affiche des métriques en temps réel : valeurs exactes du RSI et de la ligne de signal, phase de momentum, pourcentage de force de la tendance et état de la volatilité.
- Entièrement Débloqué : Tradez sur N'IMPORTE quel symbole (Forex, Crypto, Indices, Actions) et N'IMPORTE quel intervalle de temps sans aucune limitation. Accès à vie.
Comment trader avec ?
- Continuation de tendance : Cherchez des replis où le RSI reste au-dessus de la ligne médiane à 50, mais descend légèrement vers la ligne de signal. Lorsque l'histogramme accélère (vert vif) et que les chandeliers deviennent verts vifs, c'est une entrée de continuation forte.
- Inversions : Lorsque les chandeliers deviennent violets (OB/OS extrêmes), attendez que le RSI repasse au-dessus de la ligne de signal (le nuage change de couleur) pour une configuration d'inversion à haute probabilité.
- Éviter le marché instable : Si le filtre de volatilité rend vos barres grises, restez simplement inactif et attendez que le marché se réveille.
Résumé
Profil de l'indicateur
Catégorie de l'indicateur
Volatilité
Type de résultat
Filtre
Exigences en matière de données
Barres seulement
Signaux pris en charge
Croisement
Puissance de la tendance
Volatilité
Avis clients
5.0
Avis : 1
5 | 100 % | |
4 | 0 % | |
3 | 0 % | |
2 | 0 % | |
1 | 0 % |
Avis clients
April 11, 2026
The first thing that worked was timing feels less random, and a small account test feels safer.
Discussion
Questions fréquentes
BTCUSD
Forex
Signal
Indices
EURUSD
Commodities
GBPUSD
NZDUSD
RSI
AI
XAUUSD
NAS100
ATR
USDJPY
Les produits disponibles sur cTrader Store, notamment les bots de trading, les indicateurs et les plug-ins, sont fournis par des développeurs tiers et mis à disposition à titre informatif et à des fins d'accès technique uniquement. cTrader Store n'est pas un courtier et ne fournit aucun conseil en investissement, aucune recommandation personnelle ni aucune garantie quant aux performances futures.


Prix
24
Ventes
662
Installations gratuites