

Bollinger Bands Advanced
อินดิเคเตอร์
2 การซื้อ
เวอร์ชัน 1.0, Apr 2026
Windows, Mac
4.0
รีวิว: 3

32
การขาย
991
ติดตั้งฟรี
คำอธิบาย
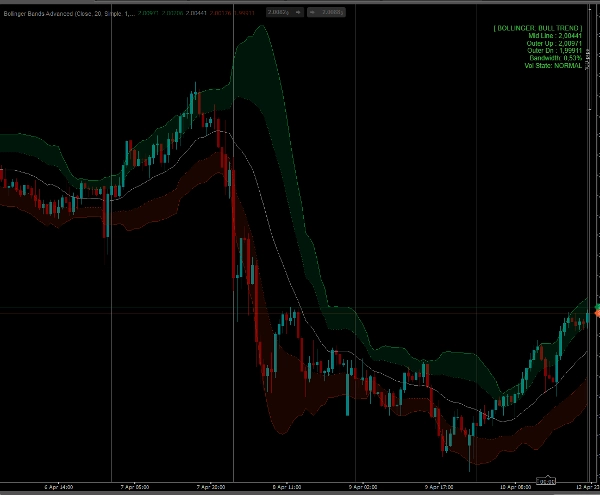
ระบบบีบและเบรกเอาต์ขั้นสูงของ Bollinger Bands
ตัวบ่งชี้ Bollinger Bands เป็นเครื่องมือหลักสำหรับนักเทรดความผันผวน แต่แถบมาตรฐานมักละเลยบริบทสำคัญ: ตลาดกำลังบีบตัวหรือไม่? แนวโน้มแข็งแกร่งพอที่จะขี่ตามหรือไม่? การเคลื่อนไหวเกินขอบเขตหรือเปล่า?
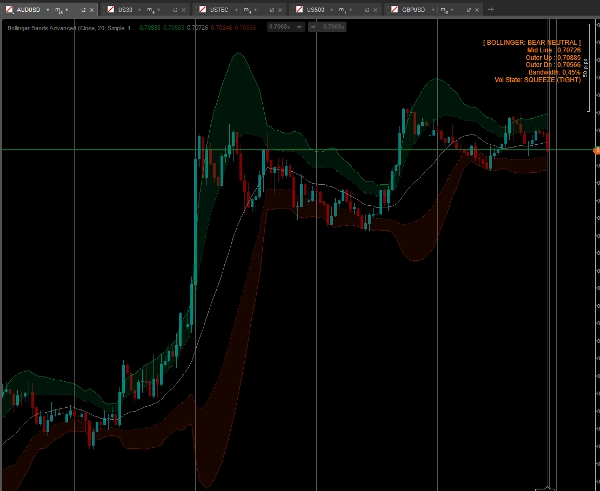
ตัวบ่งชี้ Bollinger Advanced เปลี่ยนแถบมาตรฐานให้กลายเป็นระบบการเทรดระดับมืออาชีพที่มองเห็นได้ชัดเจน ด้วยการแนะนำโซนการทำงานคู่ (Clouds), ตัวตรวจจับการบีบตัวของความผันผวนอัตโนมัติ และ Smart Paintbars มันช่วยให้คุณได้เปรียบอย่างมากในการจับจังหวะเบรกเอาต์ที่รุนแรงและการเข้าซื้อขายแบบกลับตัวที่สมบูรณ์แบบ
คุณสมบัติหลัก
- ระบบเมฆแถบคู่ (โซนการทำงาน): แทนที่จะเป็นแถบด้านนอกเพียงแถบเดียว ตัวบ่งชี้นี้จะวางแถบด้านใน (เช่น 1 ส่วนเบี่ยงเบนมาตรฐาน) และแถบด้านนอก (เช่น 2 SD) พื้นที่ระหว่างแถบเหล่านี้จะถูกระบายเป็นเมฆ
-
- ราคาภายในเมฆ? คุณอยู่ใน "โซนแนวโน้ม" ขี่ตามโมเมนตัม!
- ราคาระหว่างเส้นกลางและแถบด้านใน? คุณอยู่ใน "โซนเป็นกลาง" รอการตั้งค่าการซื้อขาย
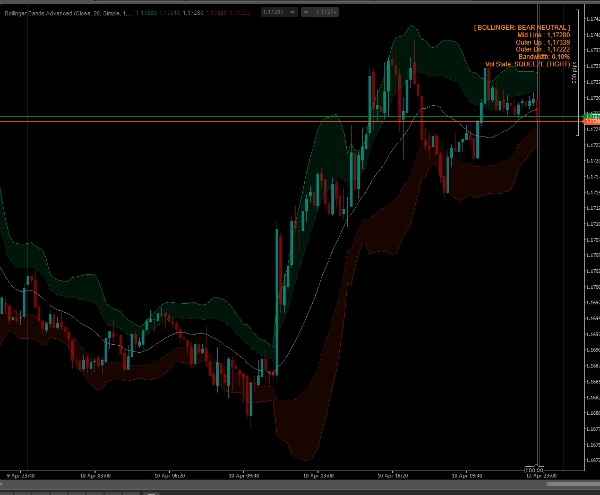
- ตัวตรวจจับการบีบตัวอัตโนมัติ: ตัวบ่งชี้จะคำนวณความกว้างของ Bollinger Band อย่างต่อเนื่องและเปรียบเทียบกับค่าเฉลี่ยเคลื่อนที่ในอดีต แดชบอร์ดบนกราฟจะแสดงคำเตือนสีส้มสดใส "SQUEEZE (TIGHT)" เมื่อแถบบีบตัวผิดปกติ เตือนคุณถึงเบรกเอาต์ที่รุนแรงที่กำลังจะเกิดขึ้น!
- การระบายสีแท่งเทียนอัจฉริยะ (Paintbars): แท่งเทียนของคุณจะเปลี่ยนสีตามความผันผวนและตำแหน่งของแถบ:
-
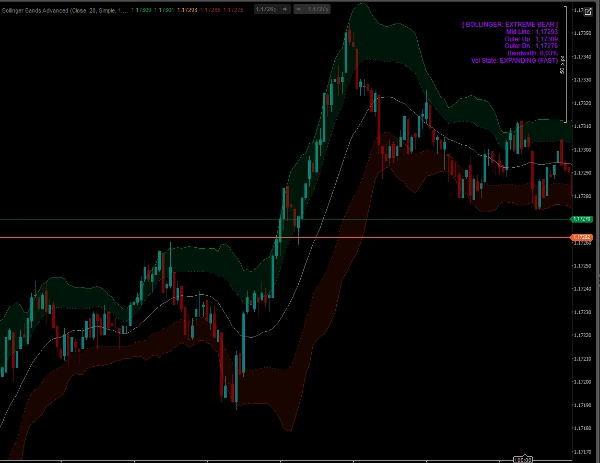
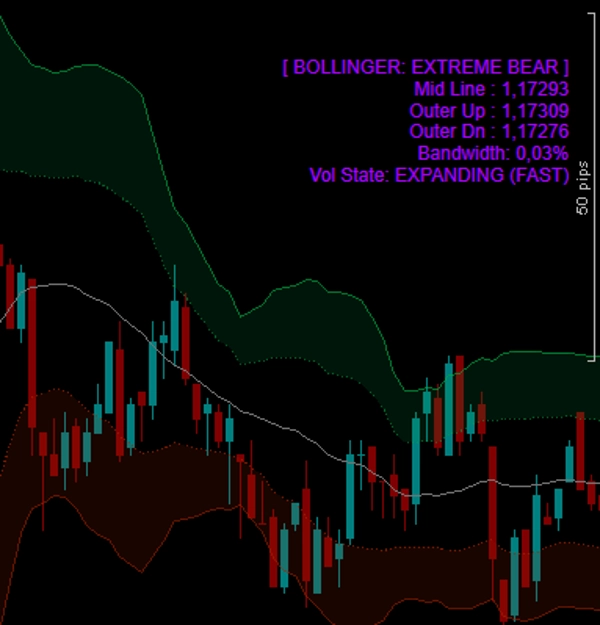
- สีม่วงนีออน/แมเจนต้า (สุดขีด): ราคาปิดนอกแถบด้านนอก สัญญาณของเบรกเอาต์ขนาดใหญ่หรือจุดสุดยอดที่เกินขอบเขต
- สีเขียว/แดงสดใส (แนวโน้ม): ราคากำลังเคลื่อนที่ภายในโซนเมฆอย่างแข็งขัน
- สีเขียว/แดงเข้ม (เป็นกลาง): ราคากำลังดึงกลับเข้าสู่ค่าเฉลี่ยเคลื่อนที่
- แดชบอร์ดบนกราฟแบบเรียลไทม์: แผงแสดงระดับแถบที่แม่นยำ, เปอร์เซ็นต์ความกว้างแถบปัจจุบัน, สถานะตลาด และสถานะความผันผวน (บีบตัว, ปกติ หรือขยายตัว)
- ปลดล็อกอย่างสมบูรณ์: เทรดได้กับสัญลักษณ์ใดก็ได้ (Forex, Crypto, Indices, Stocks) และกรอบเวลาทุกช่วงโดยไม่มีข้อจำกัด เข้าถึงได้ตลอดชีพ
วิธีเทรดกับมัน?
- เบรกเอาต์ (เล่นบีบตัว): ดูที่แดชบอร์ด เมื่อสถานะความผันผวนแสดงว่า "SQUEEZE" ตลาดกำลังสะสมพลังงาน รอแท่งเทียนที่ทะลุเข้าโซนเมฆและเปลี่ยนเป็นสีเขียว/แดงสดใส นี่คือสัญญาณให้เข้าซื้อเบรกเอาต์ที่มีโมเมนตัมสูง
- ขี่ตามแนวโน้ม: อยู่ในเทรดของคุณตราบใดที่แท่งเทียนยังคงเป็นสีเขียว/แดงสดใสและแนบชิดกับเมฆด้านนอก
- การกลับตัวสู่ค่าเฉลี่ย: เมื่อแนวยาวผลักดันราคานอกแถบด้านนอกอย่างสมบูรณ์ (แท่งเทียนเปลี่ยนเป็นสีม่วง) และแดชบอร์ดแสดงว่า "EXPANDING (FAST)" ตลาดถูกดึงเกินไป เหมือนยางยืด มองหาการกลับตัวของราคากลับสู่เส้นกลาง
สรุป
สรุปโดย AI
Bollinger Bands Advanced is a volatility indicator designed to enhance traditional Bollinger Bands by providing deeper market context for trading decisions. It features a Dual-Band Cloud system that shades the area between an Inner Band (e.g., 1 standard deviation) and an Outer Band (e.g., 2 standard deviations), defining distinct market zones: the Trend Zone (price inside the Cloud) and the Neutral Zone (price between the mid-line and Inner Band).
An automatic Volatility Squeeze Detector monitors Bollinger Bandwidth against historical averages and signals a "SQUEEZE (TIGHT)" alert on an on-chart dashboard when volatility contracts, indicating potential explosive breakouts. Candlesticks are color-coded with Smart Paintbars to reflect volatility and band position: neon purple/magenta for extreme moves outside the Outer Band, bright green/red for active trend momentum inside the Cloud, and dark green/red for neutral pullbacks toward the moving average.
The real-time dashboard displays band levels, bandwidth percentage, market state, and volatility state (Squeezing, Normal, Expanding). The indicator supports all symbols and timeframes across Forex, Crypto, Indices, and Stocks without limitations. Trading strategies include breakout entries during squeezes, trend riding within the Cloud, and mean reversion when price is overextended beyond the Outer Band.
An automatic Volatility Squeeze Detector monitors Bollinger Bandwidth against historical averages and signals a "SQUEEZE (TIGHT)" alert on an on-chart dashboard when volatility contracts, indicating potential explosive breakouts. Candlesticks are color-coded with Smart Paintbars to reflect volatility and band position: neon purple/magenta for extreme moves outside the Outer Band, bright green/red for active trend momentum inside the Cloud, and dark green/red for neutral pullbacks toward the moving average.
The real-time dashboard displays band levels, bandwidth percentage, market state, and volatility state (Squeezing, Normal, Expanding). The indicator supports all symbols and timeframes across Forex, Crypto, Indices, and Stocks without limitations. Trading strategies include breakout entries during squeezes, trend riding within the Cloud, and mean reversion when price is overextended beyond the Outer Band.
โปรไฟล์อินดิเคเตอร์
หมวดหมู่อินดิเคเตอร์
ความผันผวน
ประเภทเอาต์พุต
สัญญาณ
การแสดงเป็นภาพ
ตัวกรอง
ข้อกำหนดด้านข้อมูล
แท่งเท่านั้น
สัญญาณที่รองรับ
Breakout
ความแข็งแกร่งของแนวโน้ม
ความผันผวน
การสนทนา
รีวิวจากลูกค้า
4.0
รีวิว: 3
5 | 0 % | |
4 | 100 % | |
3 | 0 % | |
2 | 0 % | |
1 | 0 % |
รีวิวจากลูกค้า
April 20, 2026
demo first, then maybe small size if the notes look sane. The setup needs patience.
April 18, 2026
April 13, 2026
คำถามที่พบบ่อย
Bollinger Bands
Channel
ATR
ผลิตภัณฑ์ที่มีให้บริการผ่าน cTrader Store รวมถึงบอทการเทรด อินดิเคเตอร์ และปลั๊กอิน มีให้บริการโดยนักพัฒนาบุคคลที่สามและมีไว้เพื่อวัตถุประสงค์ในการเข้าถึงข้อมูลและทางเทคนิคเท่านั้น cTrader Store ไม่ใช่โบรกเกอร์และไม่ได้ให้คำแนะนำการลงทุน คำแนะนำส่วนบุคคล หรือการรับประกันผลการดำเนินงานในอนาคต






























ราคา
32
การขาย
991
ติดตั้งฟรี