
TradingViewMACD
Индикатор
3 покупки
Версия 1.0, Feb 2025
Windows, Mac
5.0
Отзывы: 1

Описание
Индикатор TradingViewMACD
Повышайте эффективность своей торговой стратегии с помощью нашего высоконастраиваемого индикатора TradingViewMACD, разработанного для платформы cAlgo. Этот мощный инструмент сочетает гибкость и точность, необходимые для оптимизации вашего рыночного анализа.
Основные характеристики:
- Настраиваемые параметры:
-
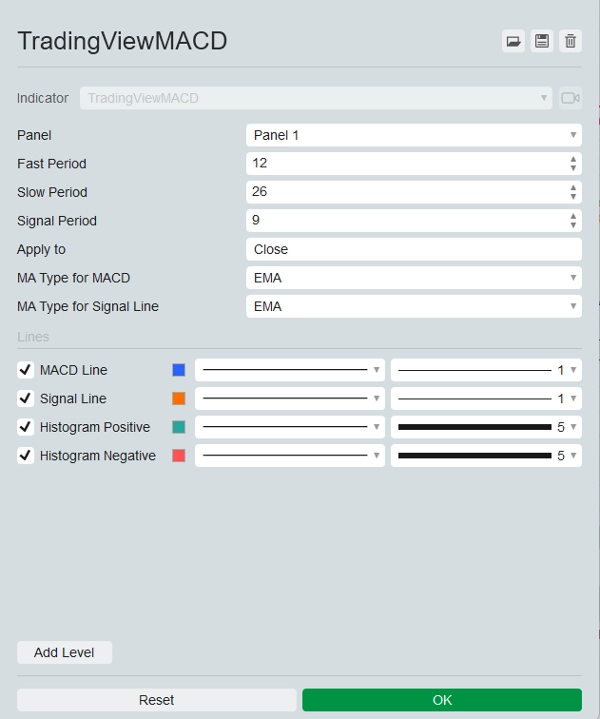
- Быстрый период: настройте период быстрого скользящего среднего в соответствии с вашим стилем торговли.
- Медленный период: настройте период медленного скользящего среднего для повышения точности сигналов.
- Период сигнала: установите период сигнальной линии для точной настройки точек входа и выхода.
- Применяемая цена: выберите из открытой, высокой, низкой, закрытия, медианной, типичной или взвешенной цены для применения индикатора.
- Несколько типов скользящих средних:
-
- Выбирайте между простым скользящим средним (SMA) и экспоненциальным скользящим средним (EMA) как для линии MACD, так и для сигнальной линии, обеспечивая гибкость в вашем анализе.
- Визуальные отображения:
-
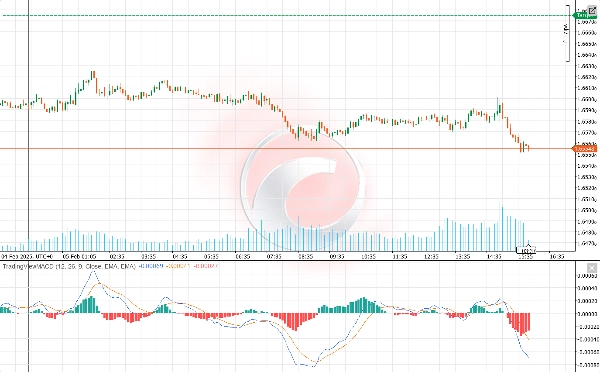
- Линия MACD: отображается ярким синим цветом для четкой видимости.
- Сигнальная линия: выделена ярким оранжевым цветом для легкого отличия от линии MACD.
- Гистограмма: различает положительные и отрицательные значения с помощью зеленого и красного цветов соответственно, предлагая четкое визуальное представление рыночного импульса.
- Расширенные рыночные инсайты:
-
- Индикатор вычисляет разницу между быстрыми и медленными скользящими средними для генерации линии MACD.
- Вычисляет сигнальную линию как скользящее среднее линии MACD.
- Гистограмма визуально отображает разницу между линией MACD и сигнальной линией, помогая выявлять потенциальные сигналы на покупку и продажу.
- Удобство использования:
-
- Легко устанавливается и настраивается, позволяя трейдерам любого уровня воспользоваться его продвинутыми функциями.
- Полная документация и поддержка клиентов обеспечивают беспроблемный опыт использования.
Раскройте весь потенциал вашей торговой стратегии с индикатором TradingViewMACD. Улучшайте свой рыночный анализ, принимайте обоснованные решения и опережайте рынок с этим незаменимым торговым инструментом.
Сводка
ИИ-сводка
The TradingViewMACD indicator for the cAlgo platform is a customizable technical analysis tool designed to enhance market analysis. It calculates the difference between fast and slow moving averages to generate the MACD line, computes a signal line as the moving average of the MACD line, and displays a histogram representing the difference between these lines to help identify potential buy and sell signals.
Key features include adjustable parameters such as fast period, slow period, signal period, and applied price (open, high, low, close, median, typical, or weighted). Users can select between Simple Moving Average (SMA) and Exponential Moving Average (EMA) types for both the MACD and signal lines, providing analytical flexibility.
Visual outputs consist of a blue MACD line, an orange signal line, and a histogram with green and red colors indicating positive and negative momentum, respectively. The indicator is designed for ease of installation and configuration, supported by comprehensive documentation and customer support to accommodate traders of all experience levels.
Профиль индикатора
Отзывы покупателей
5.0
Отзывы: 1
5 | 100 % | |
4 | 0 % | |
3 | 0 % | |
2 | 0 % | |
1 | 0 % |
Отзывы покупателей
November 9, 2025
TradingView MACD brings the familiar feel straight to cTrader 🚀 - smooth, light, and 100% accurate to the original. Perfect for traders switching from TV who love clean momentum signals. Missing alerts, but flawless for classic trend and divergence play.
Обсуждение
Частые вопросы
Signal
MACD
Продукты, доступные в cTrader Store, включая торговых ботов, индикаторы и плагины, предоставляются сторонними разработчиками и доступны исключительно в информационных и технических целях. cTrader Store не является брокером и не предоставляет инвестиционные консультации, персональные рекомендации или какие-либо гарантии будущей доходности.


Цена
С 22/11/2024
133
Продажи
2.58K
Бесплатные установки