
Описание
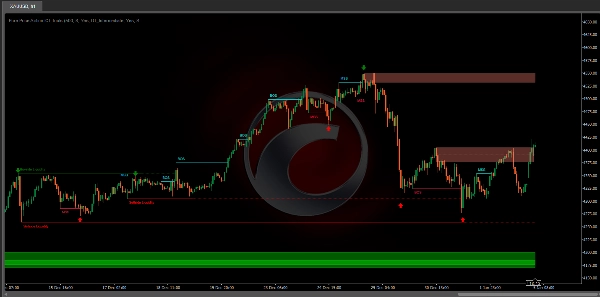
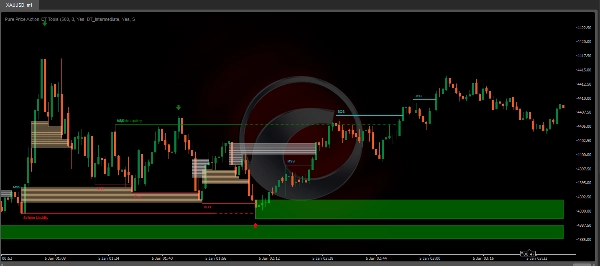
Индикатор Pure Price Action ICT Tools предназначен для анализа чистого ценового действия, автоматически выявляя структуры рынка в реальном времени, уровни ликвидности, блоки ордеров и брейкеров, а также зоны отсутствия ликвидности.
Его уникальная особенность заключается в исключительной опоре на ценовые паттерны без ограничений со стороны пользовательских настроек, что обеспечивает надежный и объективный анализ динамики рынка.
Ключевые особенности
- Структуры рынка
Сдвиг структуры рынка, также известный как изменение характера (CHoCH), является ключевым событием в анализе ценового действия, указывающим на возможное изменение настроений или направления рынка. MSS происходит, когда цена разворачивается от установленного тренда, сигнализируя о том, что преобладающий тренд может терять силу и возможен разворот. Этот сдвиг часто определяется ключевыми техническими паттернами, такими как более низкий минимум в нисходящем тренде или более высокий максимум в восходящем, что указывает на ослабление текущей силы тренда.
Прорыв структуры обычно указывает на продолжение текущего рыночного тренда. Это событие происходит, когда цена решительно выходит за пределы предыдущего максимума или минимума, подтверждая силу преобладающего тренда. В восходящем тренде BOS отмечается пробоем цены выше предыдущего максимума, а в нисходящем — пробоем ниже предыдущего минимума.
Хотя сдвиг структуры рынка (MSS) может указывать на потенциальный разворот тренда, а прорыв структуры (BOS) часто подтверждает продолжение тренда, они не гарантируют полного разворота или продолжения. Уровни MSS и BOS также могут выступать зонами ликвидности или областями консолидации цены, а не однозначно сигнализировать об изменении направления рынка. Трейдерам следует осторожно подходить к этим сигналам и подтверждать их дополнительными факторами перед принятием торговых решений. Для получения дополнительной информации о других компонентах инструмента, пожалуйста, обратитесь к следующим разделам.
- Блоки ордеров и брейкеров
Блоки ордеров и брейкеров — ключевые понятия в анализе ценового действия, помогающие трейдерам выявлять значимые уровни в структуре рынка.
Блоки ордеров — это конкретные ценовые зоны, где происходила значительная покупательская или продавательская активность. Эти зоны часто отражают действия крупных институциональных трейдеров или маркет-мейкеров, которые выполняют крупные ордера, влияющие на рынок.
Блоки брейкеров — это конкретные ценовые зоны, где происходит сильный разворот, вызывающий нарушение преобладающей структуры рынка. Эти блоки указывают на области, где цена столкнулась с существенным сопротивлением или поддержкой, что привело к развороту.
В итоге ликвидность со стороны покупателей и продавцов предоставляет важные сведения о динамике спроса и предложения на рынке, помогая трейдерам принимать обоснованные решения на основе доступности ордеров на различных ценовых уровнях.
- Ликвидность со стороны покупателей и продавцов
Зоны ликвидности как со стороны покупателей, так и со стороны продавцов критически важны для выявления потенциальных точек разворота на рынке. Эти зоны концентрируют значительный интерес к покупке или продаже, влияя на будущие ценовые движения.
В итоге ликвидность со стороны покупателей и продавцов предоставляет важные сведения о динамике спроса и предложения на рынке, помогая трейдерам принимать обоснованные решения на основе доступности ордеров на различных ценовых уровнях.
- Зоны отсутствия ликвидности
Зоны отсутствия ликвидности — это пробелы или области на ценовом графике, где отсутствует торговая активность. Эти зоны представляют собой области с минимальным или отсутствующим количеством ордеров на покупку или продажу, что часто приводит к резким ценовым движениям при входе рынка в эти области.
В итоге зоны отсутствия ликвидности являются важными областями на ценовом графике, характеризующимися отсутствием торговой активности. Эти зоны могут приводить к быстрым ценовым движениям и повышенной волатильности, что делает их важным фактором для трейдеров при анализе и принятии решений.
- Точки разворота
Точки разворота цены обычно называют swing points. Трейдеры часто анализируют исторические точки разворота, чтобы определить рыночные тренды и выявить потенциальные точки входа и выхода из сделок.
Обратите внимание, что в этом скрипте они подвержены обратной прорисовке, то есть они не расположены там, где были обнаружены.
Обнаружение точек разворота и уникальная особенность этого скрипта основаны исключительно на ценовом действии, исключая необходимость числовых пользовательских настроек. Процесс начинается с обнаружения краткосрочных точек разворота:
- Краткосрочный максимум (STH): определяется как ценовой пик, окруженный с обеих сторон более низкими максимумами.
- Краткосрочный минимум (STL): определяется как ценовой минимум, окруженный с обеих сторон более высокими минимумами.
Точки разворота среднего и долгосрочного периода обнаруживаются по тому же принципу, но с небольшим изменением. Вместо прямого анализа ценовых свечей используются ранее обнаруженные краткосрочные точки разворота. Для точек среднего срока анализируются краткосрочные точки, а для долгосрочных — среднесрочные.
Этот метод обеспечивает надежный и объективный анализ динамики рынка, предоставляя трейдерам достоверные сведения о структурах рынка. Обнаруженные точки разворота служат основой для определения структур рынка, уровней ликвидности со стороны покупателей и продавцов, а также блоков ордеров и брейкеров, представленных в этом инструменте.
В итоге точки разворота являются важными элементами технического анализа, помогая трейдерам выявлять тренды, уровни поддержки и сопротивления, а также оптимальные точки входа и выхода. Понимание точек разворота позволяет трейдерам принимать обоснованные решения на основе естественных ценовых движений на рынке.
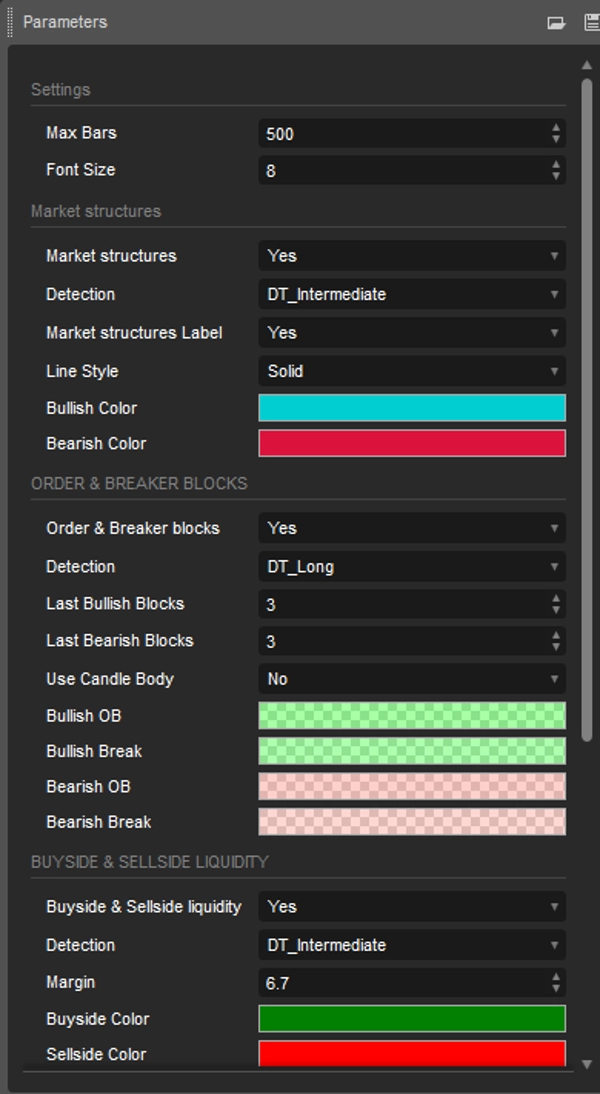
Настройки
- Структуры рынка
Структуры рынка: переключает видимость структур рынка, включая сдвиги и прорывы.
Обнаружение: опция, позволяющая пользователям обнаруживать структуры рынка на основе значимости уровней swing, включая краткосрочные, среднесрочные и долгосрочные.
Метки структур рынка: управляет видимостью меток, выделяющих тип структуры рынка.
Стиль линии: настраивает стиль линий, представляющих структуру рынка.
- Блоки ордеров и брейкеров
Блоки ордеров и брейкеров: переключает видимость блоков ордеров и брейкеров.
Обнаружение: опция, позволяющая пользователям обнаруживать блоки ордеров и брейкеров на основе значимости уровней swing, включая краткосрочные, среднесрочные и долгосрочные.
Последние бычьи блоки: количество последних бычьих блоков ордеров/брейкеров для отображения на графике.
Последние медвежьи блоки: количество последних медвежьих блоков ордеров/брейкеров для отображения на графике.
Использовать тело свечи: позволяет использовать тела свечей в качестве зон блоков ордеров вместо полного диапазона свечи.
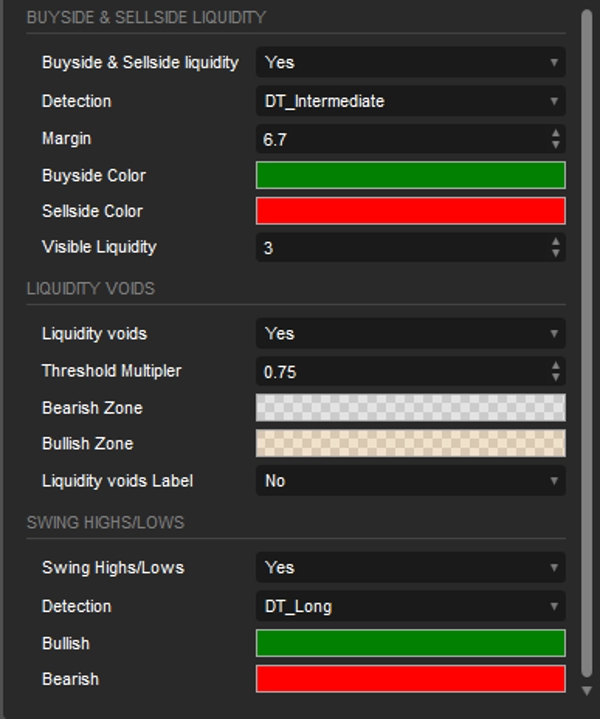
- Ликвидность со стороны покупателей и продавцов
Ликвидность со стороны покупателей и продавцов: переключает видимость уровней ликвидности со стороны покупателей и продавцов.
Обнаружение: опция, позволяющая пользователям обнаруживать ликвидность со стороны покупателей и продавцов на основе значимости уровней swing, включая краткосрочные, среднесрочные и долгосрочные.
Маржа: устанавливает маржу/чувствительность для обнаружения уровня ликвидности.
Видимая ликвидность: управляет количеством уровней/зон ликвидности, отображаемых на графике.
- Зоны отсутствия ликвидности
Зоны отсутствия ликвидности: включает отображение как бычьих, так и медвежьих зон отсутствия ликвидности.
Множитель порога: задает множитель для порога, который жестко привязан к диапазону ATR за 200 периодов.
Метка: включает отображение метки, указывающей на зоны отсутствия ликвидности.
- Точки разворота
Максимумы/минимумы swing: переключает видимость уровней swing.
Обнаружение: опция, позволяющая пользователям обнаруживать уровни swing на основе значимости уровней swing, включая краткосрочные, среднесрочные и долгосрочные.
Сводка
Key functionalities include:
- Market Structures: Detects Market Structure Shifts (potential trend reversals) and Breaks of Structure (trend continuations) based on price patterns.
- Order & Breaker Blocks: Highlights significant price zones where institutional buying/selling or strong reversals occur.
- Buy-side & Sell-side Liquidity: Identifies zones of concentrated buying or selling interest that may influence price movements.
- Liquidity Voids: Marks price chart gaps with minimal trading activity, often leading to sharp price moves.
- Swing Points: Detects short-, intermediate-, and long-term reversal points to aid in trend analysis and trade decision-making.
The tool offers customizable settings to toggle visibility and detection sensitivity for each feature, including options to adjust detection based on swing level significance and display preferences. It supports analysis across various markets such as Forex, Crypto (e.g., BTCUSD), and indices (e.g., NAS100, XAUUSD). The indicator provides an objective framework for analyzing market dynamics based solely on price action patterns.
Отзывы покупателей
5 | 67 % | |
4 | 0 % | |
3 | 33 % | |
2 | 0 % | |
1 | 0 % |


