
Simple ICT Concepts
Indicador
3 compras
Versión 1.0, Dec 2025
Windows, Mac
4.0
Valoraciones: 1
Descripción
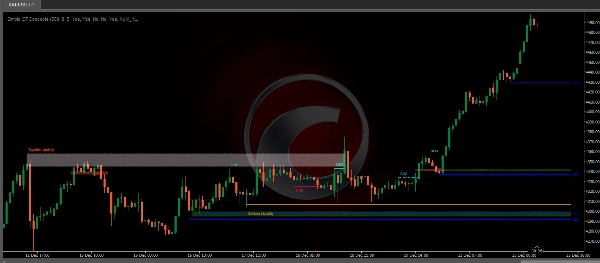
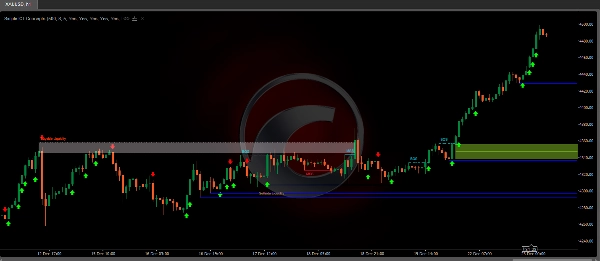
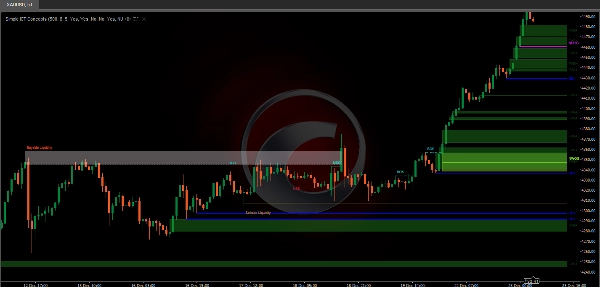
El Indicador Simple ICT Concepts es una herramienta poderosa diseñada para ayudar a los traders a aplicar los principios de la metodología Inner Circle Trader (ICT). Este indicador se centra en identificar zonas clave como niveles de liquidez, soporte y resistencia, y estructura del mercado, convirtiéndolo en un activo invaluable para traders de acción del precio y conceptos de dinero inteligente.
Características Clave
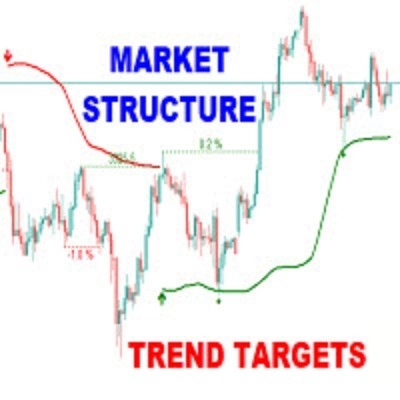
Estructura del Mercado:
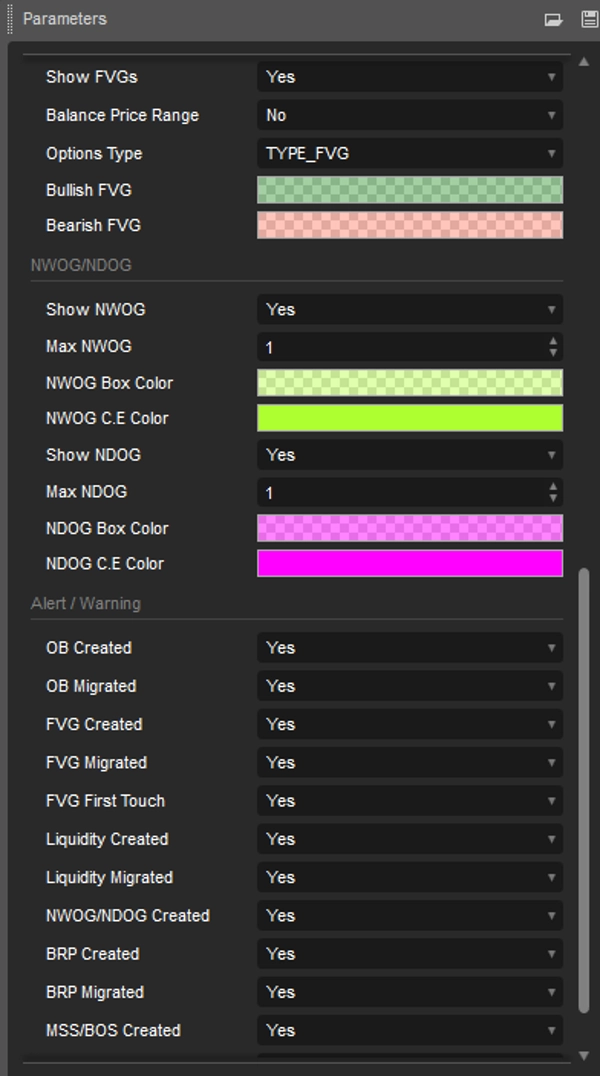
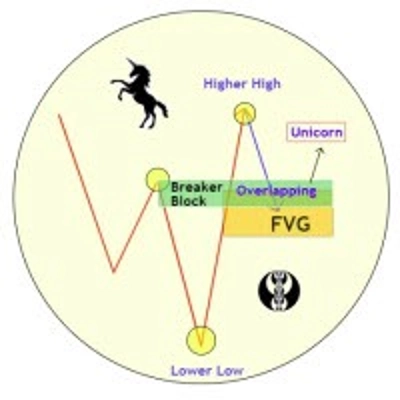
Las etiquetas de estructura del mercado se construyen a partir de que el precio rompe un punto de giro previo. Esto permite al usuario determinar la tendencia actual del mercado basándose en la acción del precio.Se incluyen dos tipos de etiquetas de Estructura del Mercado:Cambio de Estructura del Mercado (MSS)Ruptura de Estructura (BOS)Un MSS ocurre cuando el precio rompe un mínimo de giro en una tendencia alcista o un máximo de giro en una tendencia bajista, destacando una posible reversión.Esto a menudo se etiqueta como "CHoCH", pero ICT lo especifica como MSS. Por otro lado, las etiquetas BOS ocurren cuando el precio rompe un máximo de giro en una tendencia alcista o un mínimo de giro en una tendencia bajista.La ocurrencia de estos puntos de giro particulares es causada por retrocesos (inducciones) que destacan la búsqueda de liquidez en marcos temporales inferiores.Puntos clave de giro: Máximos más altos (HH) y mínimos más bajos (LL), mínimos más altos (HL) y máximos más bajos (LH)Desplazamiento:Los desplazamientos son escenarios donde el precio forma velas sucesivas del mismo sentimiento (alcista/bajista) con cuerpos grandes y sombras cortas.Estos pueden identificarse más técnicamente por correlación automática positiva (un cambio de cierre a apertura es más probable que sea seguido por un cambio del mismo signo) así como por agrupación de volatilidad (grandes cambios son seguidos por grandes cambios).Los desplazamientos pueden ser la causa de la formación de desequilibrios así como de la estructura del mercado, estos pueden ser causados por la ejecución completa de una meta orden.Desequilibrio de Volumen:Un Desequilibrio de Volumen (V.I.) ocurre cuando hay un área de precio que ha quedado sin cuerpo de vela. Hay movimiento arriba y abajo en la superposición de las mechas, sin embargo, dado que la mayor parte del volumen está en el cuerpo de la vela, denominamos esto un Desequilibrio de Volumen.Bloques de Orden:Un bloque de orden ICT (Inner Circle Trader) es un área de precio en un gráfico donde grandes inversores institucionales colocan órdenes significativas de compra o venta. Los bloques de orden son un concepto clave en el trading, ya que pueden ayudar a los traders a identificar niveles potenciales de soporte y resistencia, y anticipar reversiones de precio.Liquidez:Los niveles de liquidez del lado comprador/vendedor destacan niveles de precio donde los participantes del mercado podrían colocar órdenes limit/stop.Los niveles de liquidez del lado comprador agruparán las órdenes de stop-loss de traders cortos así como las órdenes limit de traders largos, mientras que los niveles de liquidez del lado vendedor agruparán las órdenes de stop-loss de traders largos así como las órdenes limit de traders cortos.Estos niveles pueden desempeñar diferentes roles. Participantes del mercado más informados podrían ver estos niveles como fuente de liquidez, y una vez que la liquidez sobre un nivel específico se reduce, se encontrará en otra área.FVG/IFVG:Brechas de Valor Justo: Una formación de tres velas donde las sombras de las velas adyacentes a la vela central no se superponen, esto destaca un área de brecha.Brechas de Valor Justo Implícitas: A diferencia de la brecha de valor justo, la brecha de valor justo implícita tiene sombras de velas adyacentes a la vela central que se superponen. El área de brecha se construye a partir del promedio entre la sombra respectiva y la extremidad más cercana del cuerpo de su vela.Rango de Precio Balanceado: Los rangos de precio balanceados ocurren cuando una brecha de valor justo se superpone con una brecha de valor justo previa, con el área de superposición resultando en el área de desequilibrio.NWOG/NDOG:Este indicador revela las brechas de apertura de nueva semana (NWOG) y brechas de apertura de nuevo día (NDOG). La NWOG es la brecha entre el precio de cierre del viernes y el precio de apertura del domingo. La NDOG es la brecha entre el precio de apertura y el precio de cierre del día anterior.
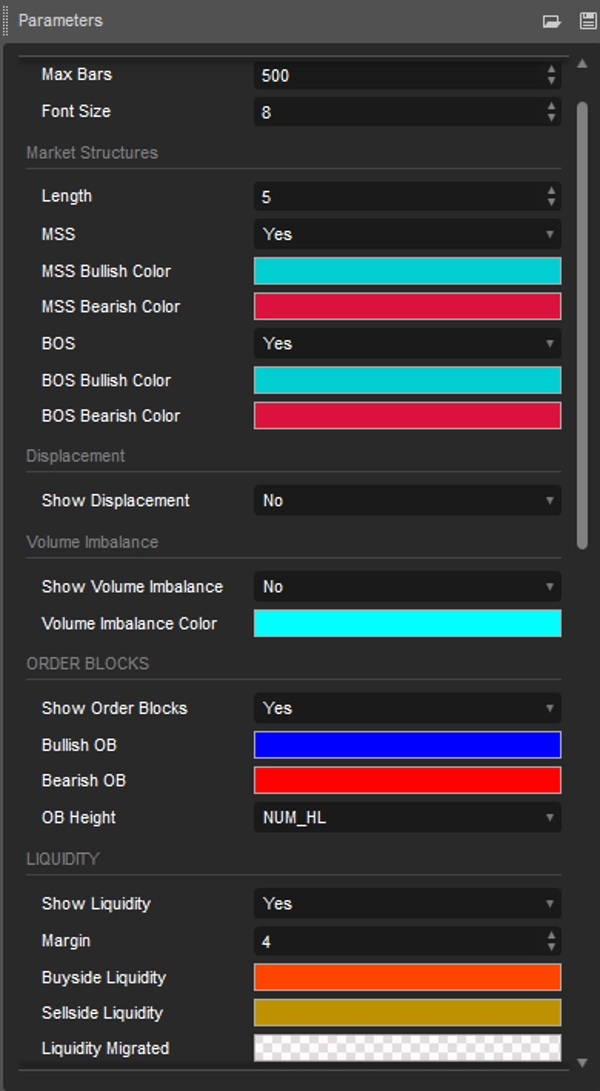
Características Personalizables
Los usuarios pueden ajustar configuraciones como la longitud de datos, colores y estilos de visualización para adaptarse a sus preferencias de trading.
Beneficios para los Traders
Ahorra tiempo en análisis manual, mejorando la eficiencia del trading.
Ayuda a tomar decisiones rápidas e informadas durante condiciones de mercado volátiles.
Fácil de usar tanto para principiantes como para traders experimentados.
Conclusión
El Indicador Simple ICT Concepts no es solo una herramienta sino una solución integral para traders que buscan implementar eficazmente estrategias ICT. Es una opción robusta para mejorar el análisis del mercado y ejecutar operaciones precisas.
Resumen
Resumen de IA
The Simple ICT Concepts Indicator is a technical analysis tool designed to assist traders in applying the Inner Circle Trader (ICT) methodology. It identifies key market zones including liquidity levels, support and resistance, and market structure to support price action and smart money concept trading. The indicator labels market structure shifts (MSS) and breaks of structure (BOS) based on swing point breaks, helping users determine current market trends. It detects displacements characterized by successive candles with strong directional sentiment, volume imbalances where candle bodies leave gaps, and order blocks representing institutional buy or sell zones. The tool highlights buy-side and sell-side liquidity levels, indicating where stop-loss and limit orders cluster. It also identifies fair value gaps (FVG), implied fair value gaps (IFVG), balanced price ranges, and new week/day opening gaps (NWOG/NDOG). Users can customize settings such as data length, colors, and display styles to fit their trading preferences. The indicator aims to save time on manual analysis and facilitate quick, informed decisions in volatile markets. It is suitable for both beginners and experienced traders seeking to implement ICT strategies effectively across markets including Forex, cryptocurrencies, and indices like BTCUSD, XAUUSD, and NAS100.
Perfil del indicador
Valoraciones de clientes
4.0
Valoraciones: 1
5 | 0 % | |
4 | 100 % | |
3 | 0 % | |
2 | 0 % | |
1 | 0 % |
Valoraciones de clientes
December 27, 2025
The signal still needs a chart check, no surprise there. One green trade proves nothing.
Conversación
Preguntas frecuentes
BTCUSD
Forex
Signal
Fair Value Gap
Crypto
XAUUSD
NAS100
Los productos disponibles a través de cTrader Store, incluidos bots, indicadores y plugins para operar, son proporcionados por desarrolladores de terceros y están disponibles únicamente con fines informativos y de acceso técnico. cTrader Store no es un bróker, por lo que no proporciona asesoramiento de inversión, recomendaciones personales ni ninguna garantía de rentabilidad futura.


![Logotipo de "[Hamster-Coder] Bollinger Bands"](https://cdn.ctrader.com/image/webp/21d8e5d6-fb11-4bac-b9ee-cd05c2b76804_30327)


Precio
36
Ventas
2.27K
Instalaciones gratis