
Daily SD Levels - Indicator
インジケーター
4 購入済
バージョン 1.0、Aug 2025
Windows、Mac
5.0
レビュー: 1
説明
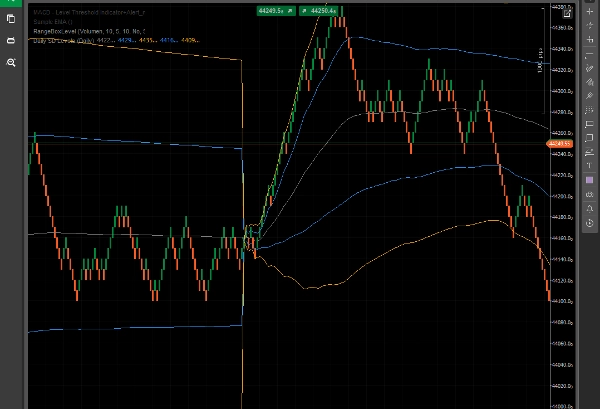
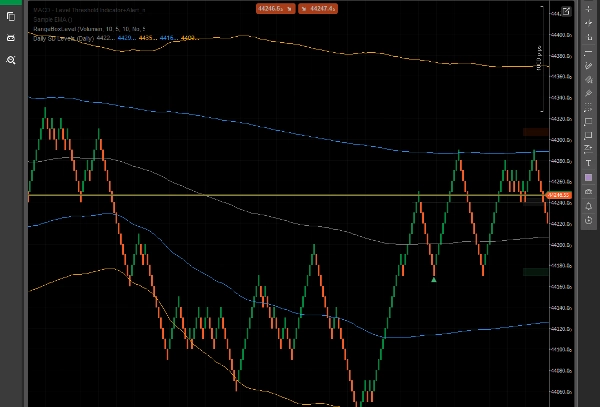
日次SDレベル – 動的VWAPベースの標準偏差バンド
この日次SDレベルインジケーターは、現在の取引日に基づいて計算された動的なVWAP(出来高加重平均価格)および標準偏差バンド(+1/+2および-1/-2)をプロットします。
このツールはトレーダーが日中のボラティリティを視覚的に評価し、潜在的なサポート/レジスタンスゾーンや価格の極値を、市場の実際の出来高と価格変動に基づいて把握するのに役立ちます。固定または任意のレベルではありません。
主な特徴:
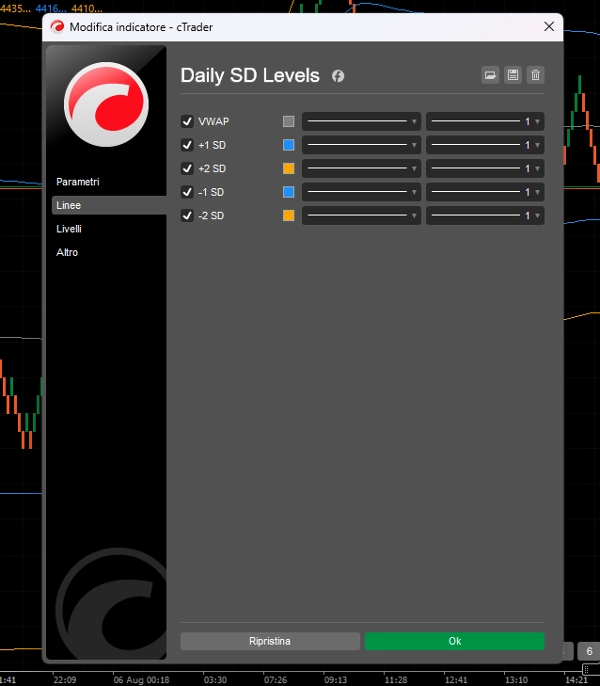
- VWAPラインで日中の公正価値を追跡。
- +1/+2および-1/-2のSDバンドで買われ過ぎ/売られ過ぎゾーンを識別。
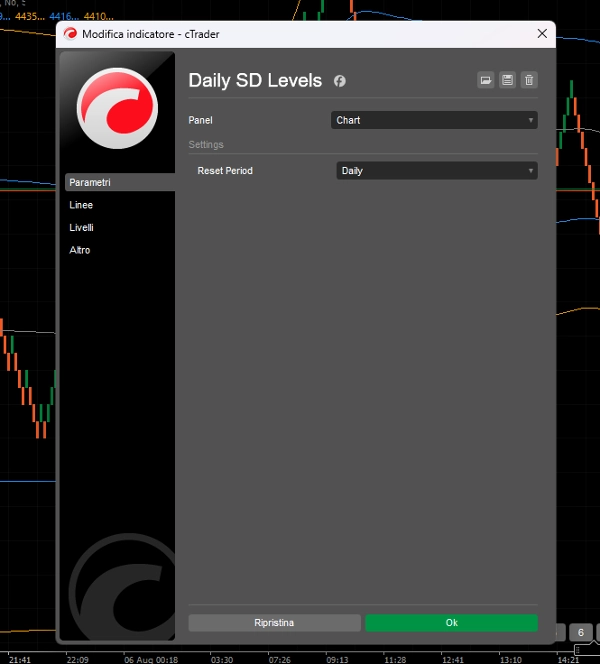
- レベルは毎日リセットされ、各セッションの価格と出来高の動態に適応。
- Renko、レンジバー、日中取引に最適化。
- 明確さと動的な価格ゾーンを必要とするトレーダー向けに設計。
このインジケーターは以下に最適です:
- 平均回帰のセットアップ。
- 反転の可能性がある伸びた動きの識別。
- 統計的境界を超えたブレイクアウトの視覚的確認。
無駄なく、ただ市場と連動するクリーンで反応的なレベル。
概要
インジケーターのプロフィール
カスタマーレビュー
5.0
レビュー: 1
5 | 100 % | |
4 | 0 % | |
3 | 0 % | |
2 | 0 % | |
1 | 0 % |
カスタマーレビュー
August 8, 2025
it gives context without making the decision, but the chart still needs a human read.
ディスカッション
よくあるご質問
cTrader Storeで入手可能な取引ボット、インジケーター、プラグインなどの商品は、第三者の開発者が提供するものであり、情報と技術の取得のみを目的としてご利用いただけます。cTrader Storeはブローカーではなく、投資助言や個人的な推奨を行うことも、将来のパフォーマンスを保証することもありません。


価格
登録日 16/07/2025
5
販売