
説明
JMA-Like – 適応型ゼロラグ移動平均
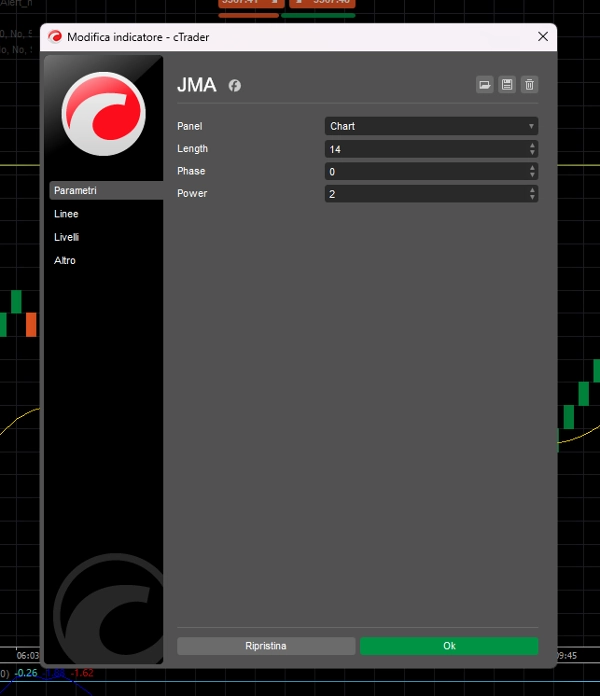
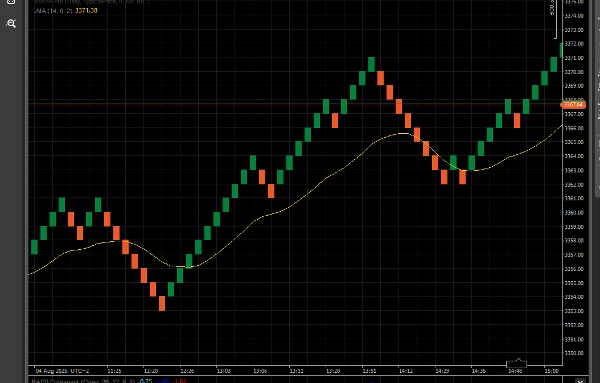
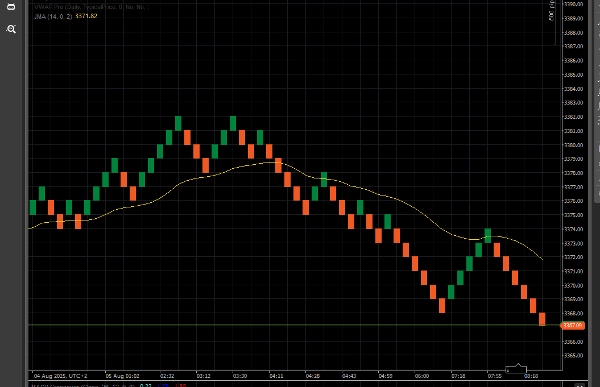
JMA Advancedは、元のJurik移動平均(JMA)の動作を再現するよう設計された、高応答かつ超滑らかな移動平均です。市場のボラティリティに動的に適応し、ラグを減らしながらノイズを除去します。
高度な平滑化アルゴリズムで構築されたJMA Advancedは、トレンドフォローおよび逆張り戦略の両方に最適です。応答性とオーバーシュートを制御するための調整可能なフェーズとパワーパラメータが含まれており、レンコ、レンジ、プライスアクショントレーダーに理想的です。
✅ ゼロラグ感覚
✅ ボラティリティ適応型
✅ すべての時間軸とチャートタイプで動作
✅ 完全にカスタマイズ可能
概要
AIによる概要
JMA-Like is an adaptive zero-lag moving average indicator designed to replicate the behavior of the original Jurik Moving Average (JMA). It features advanced smoothing algorithms that dynamically adjust to market volatility, reducing lag while filtering out noise. The indicator includes customizable Phase and Power parameters, allowing users to control responsiveness and overshoot. It is suitable for various trading styles, including trend-following and contrarian strategies, and works effectively on all timeframes and chart types such as Renko, range, and price action charts. Key features include a zero-lag feel, volatility adaptation, and full customization options.
インジケーターのプロフィール
カスタマーレビュー
5.0
レビュー: 1
5 | 100 % | |
4 | 0 % | |
3 | 0 % | |
2 | 0 % | |
1 | 0 % |
カスタマーレビュー
ディスカッション
よくあるご質問
cTrader Storeで入手可能な取引ボット、インジケーター、プラグインなどの商品は、第三者の開発者が提供するものであり、情報と技術の取得のみを目的としてご利用いただけます。cTrader Storeはブローカーではなく、投資助言や個人的な推奨を行うことも、将来のパフォーマンスを保証することもありません。
この作成者の他の商品


価格
登録日 16/07/2025
5
販売