
https://chartshots.spotware.com/c/695be69b1a3ca
https://chartshots.spotware.com/c/695be2a98e848
https://chartshots.spotware.com/c/695be7e8e88fa
https://chartshots.spotware.com/c/695be31346fe7
https://chartshots.spotware.com/c/695be3bd18aea
https://chartshots.spotware.com/c/695be5d5687c7
オートチャートパターン
📊 これは何ですか?
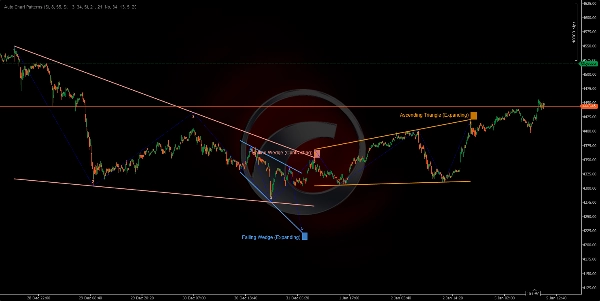
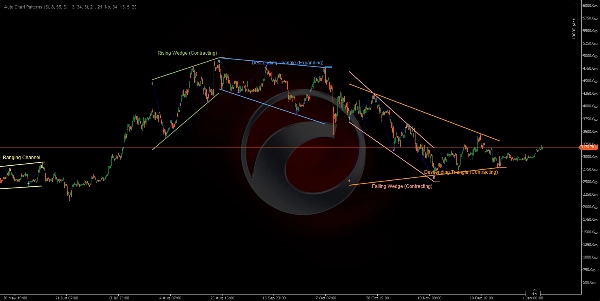
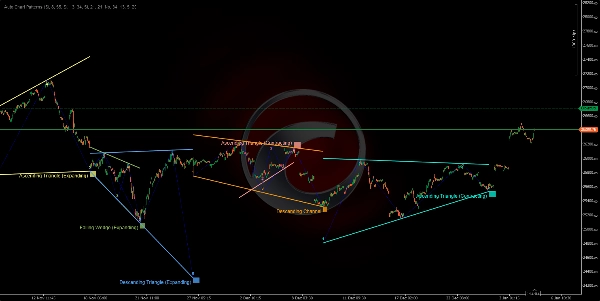
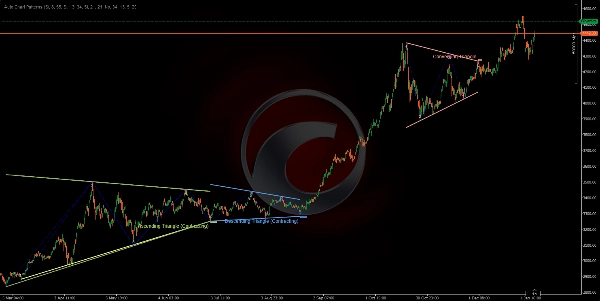
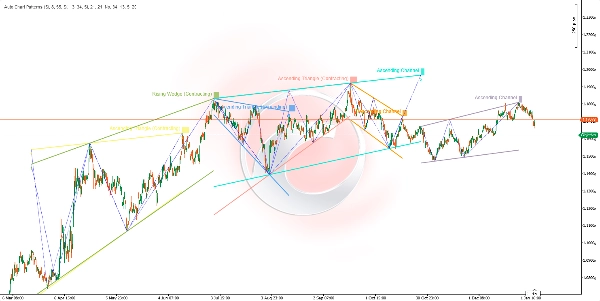
この オートチャートパターン インジケーターは、高度な幾何学的形成スキャナーであり、マルチタイムフレームのスイングポイント分析を使用して古典的なチャートパターンを自動的に検出し視覚化します。チャネル、ウェッジ、三角形を含む 14種類の異なる幾何学的形成 を特定し、スイングの高値と安値をトレンドラインで結ぶことで包括的なパターン認識システムを作り出します。
🎯 何のために使うのですか?
このインジケーターはトレーダーが以下を行うのに役立ちます:
- 自動的に検出する 14の古典的チャートパターン (チャネル、ウェッジ、三角形) 📐
- 潜在的なブレイクアウトゾーンを特定する 可能性のあるブレイクアウトゾーン が発生する前に ⚡
- 幾何学的な価格関係を通じて 市場構造を視覚化する 🔍
- 視覚的確認を伴う 継続および反転パターンの取引 ✅
- トレンド方向と最終ピボットタイプによるパターンのフィルタリング トレンド方向と最終ピボットタイプ 🎛️
- 複数のスイングタイムフレームを同時に分析し 複数のスイングタイムフレームを同時に分析 して合流点を探る 🌊
🔍 どのように機能しますか?
スイングポイント検出システム 📍
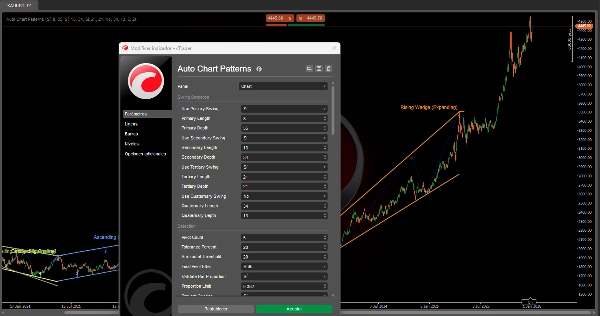
このインジケーターは最大 4つの独立したスイング検出器 を同時に動作させ、それぞれ感度を設定可能です:
- 検出ロジック:
-
- ローリングウィンドウ(期間)内の価格の高値と安値を監視します。
- 局所的なピーク(スイング高値)と谷(スイング安値)を特定します。
- 最小深度要件を満たした後にのみスイングを確認します(ノイズ防止)。
- スイング高値: 期間内で最高値をつけ、その後
MinDepthバー間下落します。 - スイング安値: 期間内で最安値をつけ、その後
MinDepthバー間上昇します。
- 4つのスイングレイヤー:
-
- プライマリースイング (デフォルト:長さ8、深度55) - 長期構造 🔵
- セカンダリースイング (デフォルト:長さ13、深度34) - 中期構造 🟢
- ターシャリースイング (デフォルト:長さ21、深度21) - 短期構造 🟡
- クアターナリースイング (デフォルト:無効) - カスタムタイムフレーム 🟣
各検出器は独立して有効/無効にでき、特定の市場構造に集中できます。
パターン形成プロセス 🎨
ステップ1 - ピボット収集:
- システムは任意のアクティブな検出器から 最新の5または6つのスイングポイント を収集します。
- ポイントは高値と安値が交互に並ぶ必要があります(ジグザグ構造)。
- 例:5ポイントの場合 高値 → 安値 → 高値 → 安値 → 高値。
ステップ2 - トレンドライン構築:
- ピボットを上部ポイント(スイング高値)と下部ポイント(スイング安値)に分けます。
- 2本のトレンドラインを描画:上限線と下限線。
- 3ポイント境界の場合:3つの組み合わせ(0-2、0-1、1-2)をテストし最適なものを選択 ⭐
- トレンドラインがローソク足の実体を貫通しないことを検証(ヒゲのみ許可)。
- 適合スコアを計算:ピボット間のバーの20%未満に接触する必要があります。
ステップ3 - 幾何学的分析:
- 上限線と下限線の角度関係を測定します。
- 形成が 拡大(広がり)、 収縮(狭まり)、または 平行(一定幅) かを判断します。
- トレンド方向を特定: 上昇、下降、または中立 (水平)。
- 幾何学に基づき 14の形成タイプ のいずれかに分類します。
ステップ4 - 検証とフィルタリング:
- バー比率チェック: スイング間隔が比例していることを確認(歪んだパターンを防止)✅
- 重複防止: 既存のパターンと競合する新しいパターンをブロック 🚫
- 重複チェック: 同じパターンの再描画を防止。
- 最終ピボットフィルター: 指定されたピボット方向(上/下/両方)で終わるパターンのみ表示。
- 形成タイプフィルター: 特定のパターンカテゴリの有効/無効切り替え。
ステップ5 - ビジュアライゼーション:
- 12色のカラーパレットから鮮やかな色で上限線と下限線を描画 🎨
- オプションでピボットを結ぶジグザグスイングラインを表示(点線の青)。
- 各スイングポイントにピボット番号(1、2、3、4、5)を表示。
- 最終ピボットにパターン名のラベルを付けます。
- ラベルの背景を色分けして明確にします。
📐 検出された14の形成パターン
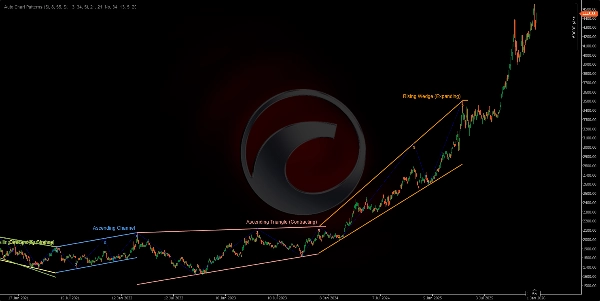
チャネル(平行形成)📦
- 上昇チャネル (上向き平行) 📈
-
- 両境界線がほぼ同じ角度で上向きに傾斜しています。
- 強気の継続トレンドを示します。
- 取引:下限線で買い、上限線で売り。
- 下降チャネル (下向き平行) 📉
-
- 両境界線がほぼ同じ角度で下向きに傾斜しています。
- 弱気の継続トレンドを示します。
- 取引:上限線で売り、下限線で買い。
- レンジチャネル (横ばい/水平) ↔️
-
- 両境界線はほぼ水平です。
- 統合または迷いを示します。
- 取引:レンジ内戦略、サポートで買い/レジスタンスで売り。
拡大ウェッジ(広がり形成)📣
4. 上昇ウェッジ(拡大) ⚠️
* 両境界線が上向きに傾斜し、間隔が広がっています。
* 弱気の反転パターン - 価格の上昇勢いが失われています。
* 取引:下限線のブレイクを待ち、ショートエントリー。
5. 下降ウェッジ(拡大) ⚠️
* 両境界線が下向きに傾斜し、間隔が広がっています。
* 強気の反転パターン - 価格の下降勢いが失われています。
* 取引:上限線のブレイクを待ち、ロングエントリー。
6. 発散三角形 (広がり三角形) 🔺
* 上限線は上向きに傾斜し、下限線は下向きに傾斜しています。
* 高ボラティリティの拡大パターン。
* 取引:非常にリスクが高く、明確な方向性のブレイクを待ちます。
7. 上昇三角形(拡大) 📊
* 上限線は水平、下限線は上向きに傾斜しています。
* 拡大するレンジでの強気継続。
* 取引:上限線のブレイクで買い。
8. 下降三角形(拡大) 📊
* 下限線は水平、上限線は下向きに傾斜しています。
* 拡大するレンジでの弱気継続。
* 取引:下限線のブレイクで売り。
収縮ウェッジ(収束形成)🔻
9. 上昇ウェッジ(収縮) 🔺
* 両境界線が上向きに傾斜し、間隔が狭まっています。
* 弱気の反転パターン - 強気の疲弊 ⚠️
* 取引:下限線のブレイクでショート。
10. 下降ウェッジ(収縮) 🔻
* 両境界線が下向きに傾斜し、間隔が狭まっています。
* 強気の反転パターン - 弱気の疲弊 ⚠️
* 取引:上限線のブレイクでロング。
収縮三角形(統合形成)△
11. 収束三角形 (対称三角形) ⚖️
* 上限線は下向きに傾斜し、下限線はほぼ同じ角度で上向きに傾斜しています。
* 中立的な統合 - 継続パターン。
* 取引:ブレイク方向を待ち、それに応じて取引。
12. 下降三角形(収縮) 📐
* 下限線は水平(サポート)、上限線は下向きに傾斜しています。
* 弱気の継続パターン 🔴
* 取引:サポートブレイク時に出来高を伴ってショート。
13. 上昇三角形(収縮) 📐
* 上限線は水平(レジスタンス)、下限線は上向きに傾斜しています。
* 強気の継続パターン 🟢
* 取引:レジスタンスブレイク時に出来高を伴ってロング。
14. 無効/不明 ❌
* 幾何学的基準を満たさないパターン。
* 自動的にフィルタリングされます。
5 | 50 % | |
4 | 50 % | |
3 | 0 % | |
2 | 0 % | |
1 | 0 % |


![「[Stellar Strategies] Market Session Ultimate」ロゴ](https://cdn.ctrader.com/image/webp/61ffd537-0125-4246-9e72-42eca1791d64_28232)


