Beschreibung
🚀 HAI Quantum V4 | Hochleistungs-Handelsdashboard mit unvergleichlicher visueller Klarheit
Vereinfachte Quantum-Analyse: Wenn das Muster vorhanden ist, findet V4 es für Sie.
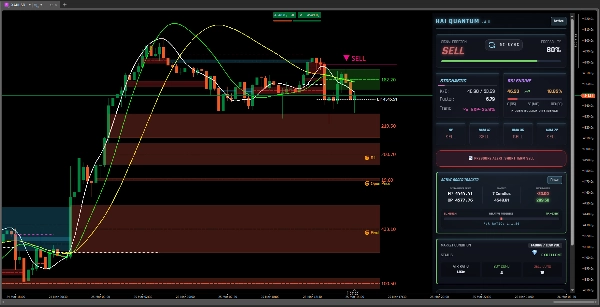
HAI Quantum V4 repräsentiert den Höhepunkt professionellen Handelsinterface-Designs, entwickelt, um Marktrauschen zu eliminieren. Während andere Trader mit verwirrenden Charts kämpfen, genießt der V4-Nutzer einen unfairen Vorteil: eine ultraklare, Echtzeit-Visualisierung der Kursbewegung und Liquidität.
Wir haben dieses Dashboard so gestaltet, dass das Verpassen einer Gelegenheit nahezu unmöglich ist. Wenn Sie nach Beobachtung der von HAI Quantum V4 bereitgestellten Signale das Trade-Setup nicht erkennen können, ist dies ein klares Zeichen, entweder am Spielfeldrand zu bleiben oder Ihren Gesamtansatz neu zu bewerten. Wir haben mathematische Komplexität in ihre einfachste visuelle Form destilliert, damit Sie sich ausschließlich auf die entscheidende Ausführung konzentrieren können.
💎 Hauptvorteile von HAI Quantum V4:
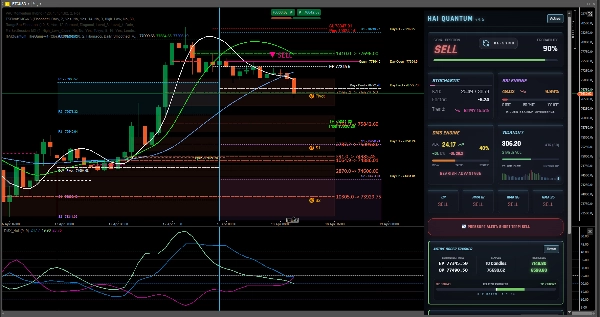
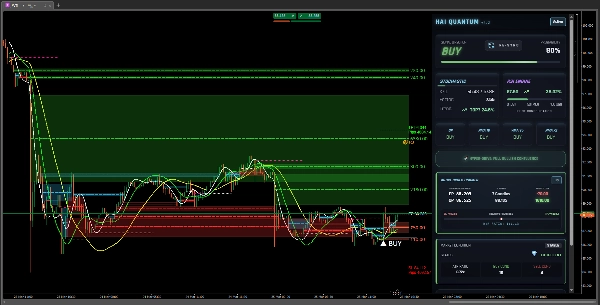
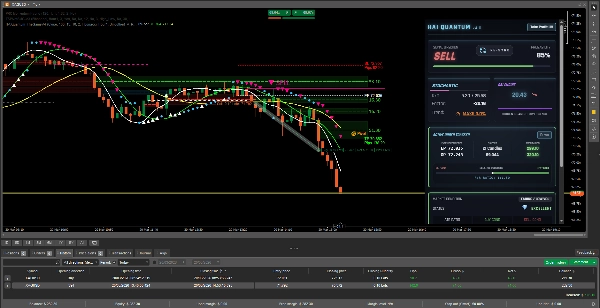
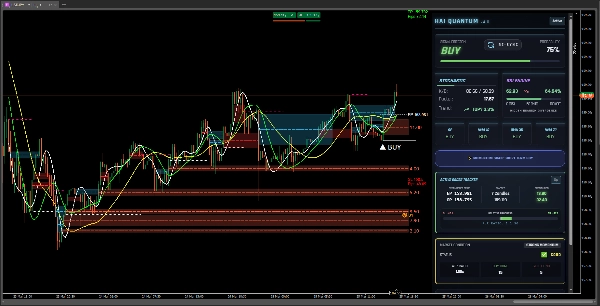
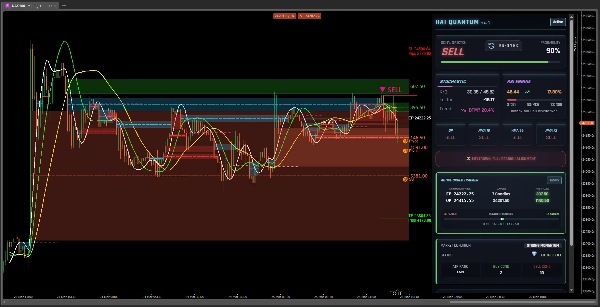
- Sofortige Mustervisualisierung: Hören Sie auf, Linien manuell zu zeichnen. Das Panel hebt in Echtzeit Zonen mit hoher Wahrscheinlichkeit und die Richtung des Orderflows hervor.
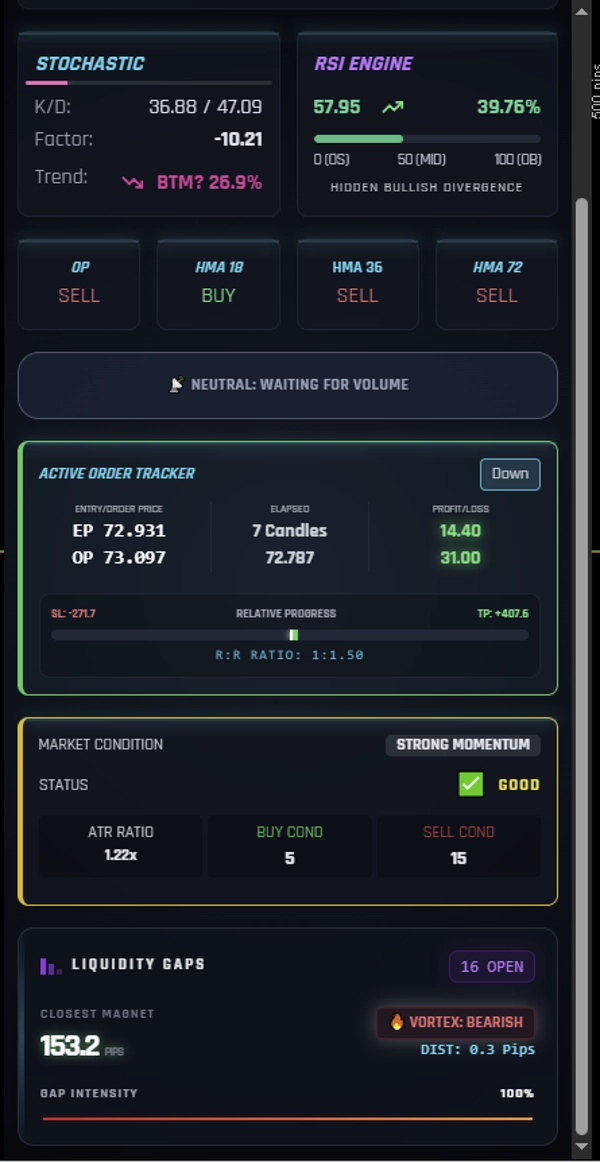
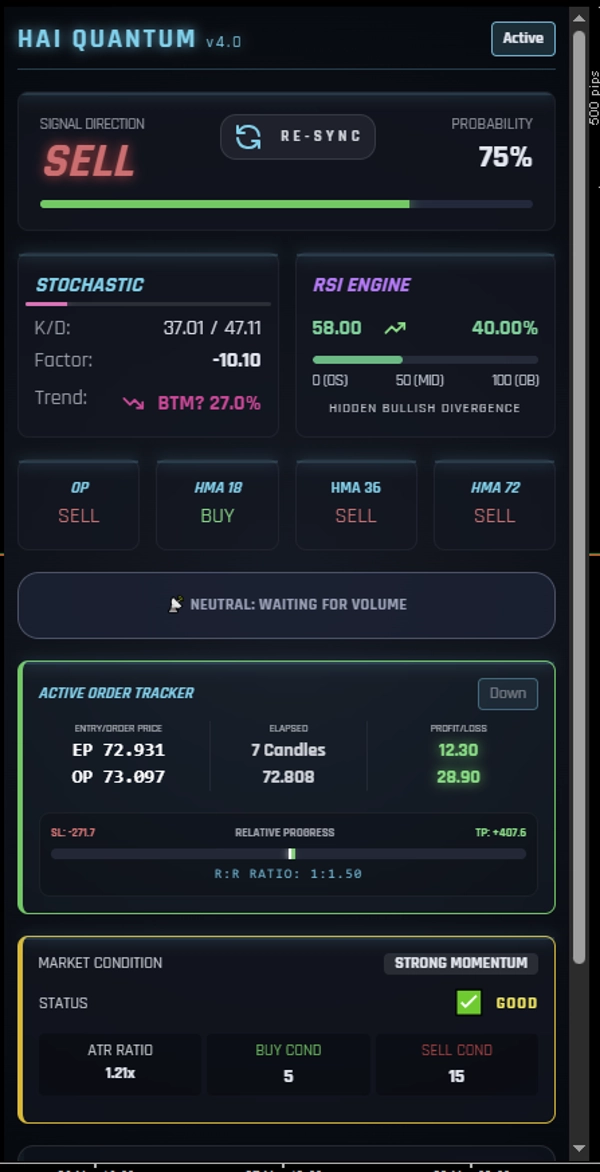
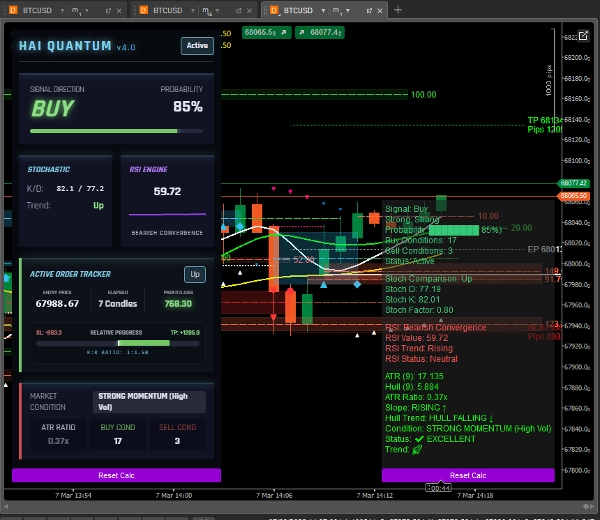
- Multidimensionale Analyse: Integriert nahtlos eine Stochastik-Engine, RSI-Engine und Hull Moving Average (HMA) Ausrichtung in eine einzige, klare Oberfläche.
- Totale Anpassbarkeit: Obwohl ab Werk als "Signalmaschine" vorkonfiguriert, sind alle Parameter vollständig einstellbar. Das Panel passt sich Ihrem Handelsstil an, nicht umgekehrt.
- Visuelles Risikomanagement: Verfolgen Sie mühelos Ihr Risiko/Ertrags-Verhältnis (R:R) und den Echtzeitfortschritt Ihrer aktiven Orders.
- Marktbedingungsstatus: Erhalten Sie klare Indikatoren für niedriges Volumen vs. vollständige bullishe/bearishe Ausrichtung ("Hyper-drive" / "Meltdown"), damit Sie niemals blind handeln.
📈 Bewährt und validiert in mehreren Märkten
Die Vielseitigkeit des HAI Quantum V4 Algorithmus wurde an den weltweit anspruchsvollsten und liquidesten Assets validiert. Wie in den beigefügten Bildern gezeigt, bietet das Panel konsistente Klarheit und Präzision über:
- Forex (Majors): Z.B., EURUSD. Erkennen Sie Mikrotrends und Liquidität im meistgehandelten Paar.
- Forex (hochvolatile Crosses): Z.B., USDJPY. Erkennen Sie kritische bullishe oder bearishe Konfluenzpunkte in Yen-basierten Paaren.
- Rohstoffe (Energie): Z.B., WTI Crude Oil. Erkennen Sie Schlüsselmuster in einem makrogetriebenen Markt.
- Edelmetalle: Z.B., XAUUSD (Gold). Filtern Sie technisches Rauschen in einem anspruchsvollen Safe-Haven-Asset.
Ein Dashboard. Eine robuste Konfiguration. Konsistente Ergebnisse in jedem Markt.
🛠 Wie man es benutzt:
- Analysieren: Beobachten Sie die Bereiche "Signalrichtung" und "Wahrscheinlichkeit" auf dem Dashboard.
- Bestätigen: Überprüfen Sie die technische Ausrichtung im Bereich "Marktbedingung" sowie die RSI-/Stochastik-Engines.
- Ausführen: Wenn alle Indikatoren übereinstimmen, ist das Muster klar. Führen Sie Ihren Trade aus und verwalten Sie Ihr Risiko entsprechend.
✅ Warum HAI Quantum V4 wählen?
Denn im Trading ist Klarheit Gewinn. Dieses Tool wurde verfeinert, um sicherzustellen, dass jeder Trader – vom Anfänger bis zum Profi – konsistente Renditen basierend auf makelloser mathematischer und visueller Analyse erzielen kann.
💎 Erweiterte Analysefunktionen (V4.5 Upgrade)
📊 DMS Engine: Das Trendradar
Das DMS (Directional Movement System) fungiert als ultimativer Überzeugungsfilter. Während andere Indikatoren nur die Richtung anzeigen, misst das DMS die Stärke hinter der Bewegung:
- ADX (Average Directional Index): Quantifiziert die Trendintensität. Ein hoher ADX bestätigt, dass der Markt die notwendige Trägheit hat, um Ihre Take-Profit-(TP)-Ziele zu erreichen, während ein niedriger ADX vor gefährlichen Seitwärtsbewegungen warnt.
- DMI (+DI / -DI): Visualisiert den Echtzeit-Kampf zwischen Käufern und Verkäufern. Der Bullish/Bearish Advantage Bereich zeigt sofort, wer den Orderflow kontrolliert.
⚡ Volatilität & Volumenfluss: Der Puls des Marktes
Damit ein Signal gültig ist, benötigt es "Treibstoff". Das neue Volatilitäts-Panel stellt sicher, dass Sie nicht in "tote" Märkte eintreten:
- ATR (Average True Range): Liefert eine präzise Messung der erwarteten Kursrange, sodass Sie Stop-Losses technisch statt emotional setzen können.
- Volumenfluss (Austrocknung / Hyper-drive): Überwacht, ob Volumen in das Asset ein- oder ausströmt. Wenn das Signal "Verkaufen" sagt, aber das Volumen "austrocknet", warnt das System Sie zu warten und schützt Ihr Kapital vor falschen Ausbrüchen.
🧠 Wie dies die Marktanalyse vervollständigt
Die Integration von DMS und Volatilität schafft einen narrensicheren Entscheidungsfilter:
- Richtung (Das "Was"): Die Signalrichtung und HMA-Ausrichtung definieren, ob nach Käufen oder Verkäufen gesucht wird.
- Momentum (Das "Wann"): Die RSI und Stochastik Engines lokalisieren den optimalen Einstiegspunkt (überkauft/überverkauft).
- Überzeugung (Das "Warum"): Die DMS Engine bestätigt, ob diese Richtung genügend institutionelle Stärke dahinter hat.
- Sicherheit (Das "Wie viel"): Das VolatilitätsPanel bestimmt, ob die Marktbedingungen stabil oder unbeständig sind, was Ihnen hilft, die Positionsgröße zu entscheiden oder ob es besser ist, neutral: auf Volumen warten zu bleiben.
Das Urteil: Mit diesen Ergänzungen sagt Ihnen HAI Quantum V4 nicht mehr nur wohin der Preis geht, sondern wie schnell und wie wahrscheinlich es ist, sein Ziel zu erreichen. Es ist der Unterschied zwischen dem Folgen einer Ahnung und der Ausführung eines Plans basierend auf hochauflösenden mathematischen Daten.
🛠 Aktualisierter Workflow:
- Analysieren: Beobachten Sie das Signal und den Wahrscheinlichkeitsprozentsatz.
- Validieren (DMS): Liegt der ADX über 20-25? Bestätigt das +DI/-DI den Vorteil?
- Filtern (Volatilität): Gibt es ausreichend Volumen? Wenn der Status "Neutral" ist, ist Geduld Ihr bestes Werkzeug.
- Ausführen: Wenn Richtung, Stärke und Volumen zusammenkommen, wird die Ausführung stressfrei.
🔥 Die V4-Philosophie: Trading für ergebnisorientierte Trader
"Erfolgreiches Trading sollte kein Rätsel sein. Wenn Sie das Muster nicht mit der Unterstützung von HAI Quantum V4 sehen können, ist es besser, nicht zu handeln. Unsere Mission ist es sicherzustellen, dass Gewinn das logische Ergebnis einer einfachen, präzisen Interpretation wird."
Zusammenfassung
Key features include full parameter customizability, visual risk management with real-time tracking of risk/reward ratios and active orders, and clear market condition indicators that distinguish between low volume and strong bullish or bearish trends. The indicator supports multiple asset classes such as major and high-volatility Forex pairs (e.g., EURUSD, USDJPY), commodities like WTI Crude Oil, and precious metals including Gold (XAUUSD).
An advanced Directional Movement System (DMS) engine measures trend strength and buyer-seller dynamics, while a volatility panel monitors market pulse through ATR and volume flow metrics to filter out weak signals. The tool guides users through a structured workflow: analyze signals, validate trend strength, filter by volatility, and execute trades based on converging indicators. This approach aims to enhance decision-making by providing clear, mathematically grounded insights into market direction, momentum, conviction, and safety.
Kundenbewertungen
5 | 75 % | |
4 | 25 % | |
3 | 0 % | |
2 | 0 % | |
1 | 0 % |