
Beschreibung
🔍 Untersucht Volumendaten über einen bestimmten historischen Zeitraum und hebt potenzielle Bereiche hervor, in denen hoch gehebelte Investoren Liquidationen ausgesetzt sein könnten, und liefert wertvolle Einblicke in das Marktverhalten.
Was macht dieser Indikator?
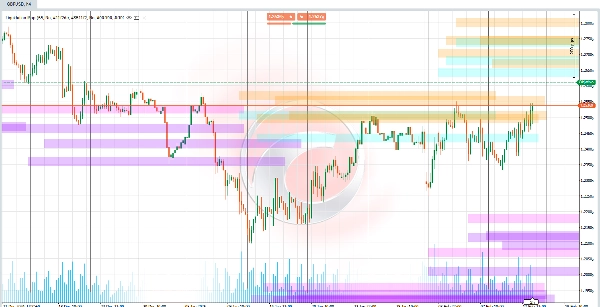
Dieser Algorithmus identifiziert Preisniveaus, bei denen massive Liquidationen von gehebelten Positionen (wie 5x, 10x, 25x, 50x oder 100x) wahrscheinlich auftreten. Diese Niveaus wirken als „Magneten“ für Preisbewegungen, da Liquidationen scharfe Marktschwankungen auslösen können. Der Indikator zeichnet horizontale Linien im Chart, die diese Schwellenwerte darstellen und in die Zukunft projizieren, um wichtige Interessenszonen vorherzusagen.
Wie werden diese Niveaus berechnet?
- Erkennung von Preis-Pivots:
🔄 Es werden kürzliche Hoch- und Tiefpunkte im Chart identifiziert (Punkte, an denen sich die Preisrichtung ändert). Diese Pivots bilden die Grundlage für die Berechnung der Liquidationsniveaus. - Volumen als Auslöser:
📊 Vergleicht das aktuelle Volumen mit einem historischen Durchschnitt. Wenn das Volumen bestimmte Schwellenwerte überschreitet (z. B. 1,2x des Durchschnitts für 100x), werden die entsprechenden Liquidationsniveaus aktiviert. - Liquidationsformel:
Je höher der Hebel, desto näher liegt das Liquidationsniveau am aktuellen Preis. -
- Für Long-Positionen: Das Liquidationsniveau wird unterhalb des Pivot-Tiefs festgelegt, berechnet basierend auf dem Hebel (z. B. 2 % darunter für 50x).
- Für Short-Positionen: Das Niveau wird oberhalb des Pivot-Hochs festgelegt, nach demselben Prinzip.
Was können Sie bei der Nutzung erwarten?
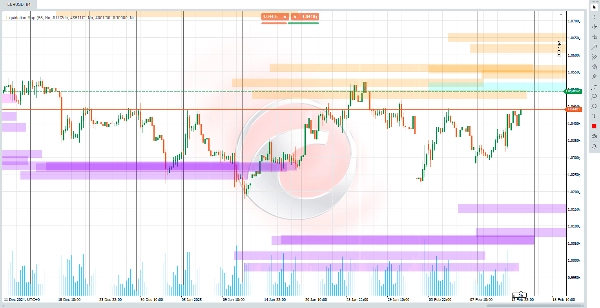
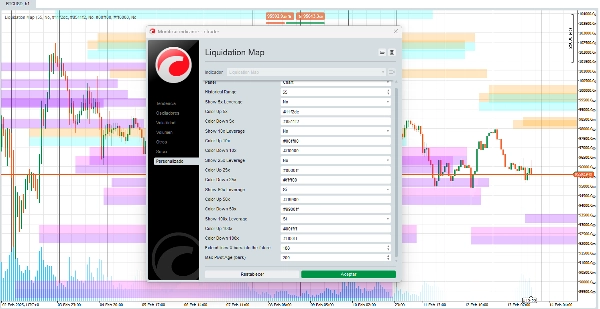
- Liquiditätslinien: 🎨 Sie sehen anpassbare horizontale Linien, die Zonen darstellen, in denen der Markt aufgrund von Liquidationen hohe Volatilität erfahren könnte.
- Konfigurierbare Hebel: ⚙️ Sie können Niveaus für jeden Hebeltyp ein- oder ausschalten (z. B. nur auf 50x und 100x fokussieren).
- Farbanpassung: 🌈 Sie können die Farbe für jeden Liquidationsbereich wählen und die Visualisierung an Ihre Vorlieben anpassen.
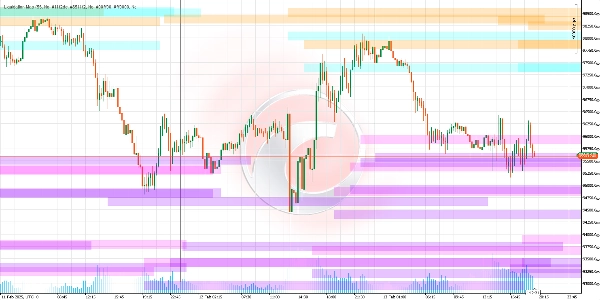
- Kongestionszonen: 🎯 Mehrere Linien, die nahe beieinander liegen, deuten auf Hochrisiko-/Hochbelohnungsbereiche hin, in denen mehrere Liquidationen gleichzeitig auftreten könnten.
Wie interpretiert man die Signale?
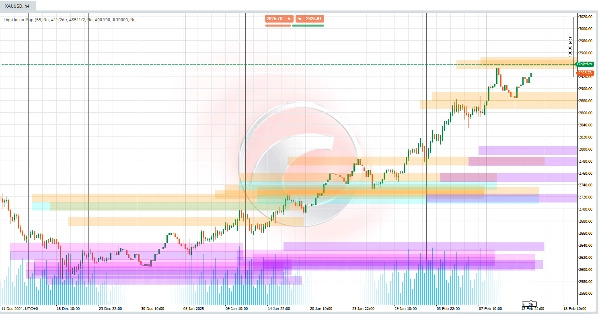
- Preis nähert sich einer Linie: 🚨 Wenn der Preis einem Liquidationsniveau nahekommt (besonders bei hohem Volumen), steigt die Wahrscheinlichkeit einer starken Bewegung.
- Farbe und Transparenz: 🎨 Die Farben variieren je nach Hebel (z. B. blau für 25x, orange für 50x). Die Transparenz zeigt die „Stärke“ des zugehörigen Volumens an (dunklere Linien = bedeutenderes Volumen).
Warum ist es nützlich?
- Proaktive Prognose: 🔮 Es analysiert nicht nur die Vergangenheit, sondern projiziert zukünftige Niveaus basierend auf aktuellen Bedingungen.
- Fokus auf Marktpsychologie: 🧠 Erzwungene Liquidationen erzeugen oft Kettenreaktionen (z. B. Stop-Loss-Orders, die weitere Verkäufe auslösen). Dieser Indikator hilft Ihnen, diese vorherzusehen.
- Anpassungsmöglichkeiten: 🛠️ Passen Sie die Visualisierung an Ihre Strategie an (z. B. priorisieren Sie höhere Hebel in volatilen Märkten).
Zu berücksichtigende Einschränkungen
- Abhängigkeit vom Volumen: 📉 Wenn das Volumen niedrig ist oder historische Daten unzureichend sind, können die Signale weniger zuverlässig sein.
- Kein Kristallkugel: 🔮 Die Niveaus zeigen wahrscheinliche Zonen an, keine Gewissheiten. Kombinieren Sie sie immer mit anderen Analysen.
- Dynamisches Umfeld: 🌍 In Märkten mit unerwarteten Nachrichten können Liquidationen außerhalb der projizierten Niveaus auftreten.
Ctrader Store Indikatoren:
Dynamic Market Structure
Analysis of Turning Points
Fibonacci Linear
Regression Multi-timeframe
Multi-Level Candle Bias
Tracker
Auto Support and
Resistance Trend Lines
Zusammenfassung
Kundenbewertungen
5 | 67 % | |
4 | 0 % | |
3 | 33 % | |
2 | 0 % | |
1 | 0 % |


![„[Stellar Strategies] Smart ADX“-Logo](https://cdn.ctrader.com/image/webp/af13b084-b6f6-41db-b7bc-c7e688b57b05_36929)


