
Beschreibung
Was ist ein „Initial Range“-Indikator?
Dieser Indikator ist eine Portierung eines Pine Script „Opening Range Breakout“-Werkzeugs.
Ursprünglich wurde es ORB – Opening Range Breakout genannt: Man nimmt die Preisspanne der ersten Minuten einer Sitzung und handelt dann den Ausbruch aus dieser Spanne.
In dieser Version haben wir es in IR – Initial Range umbenannt, aber die Idee ist dieselbe:
- Der Indikator erstellt mehrere Initial Ranges:
-
- IR5 – erste 5 Minuten
- IR15 – erste 15 Minuten
- IR30 – erste 30 Minuten
- IR60 – erste 60 Minuten
- Für jede IR gibt es:
-
- IR High
- IR Low
- IR Mid (der Mittelpunkt der Spanne)
- Sie können wählen, welche Spannen aktiv sind und welche Farben sie verwenden.
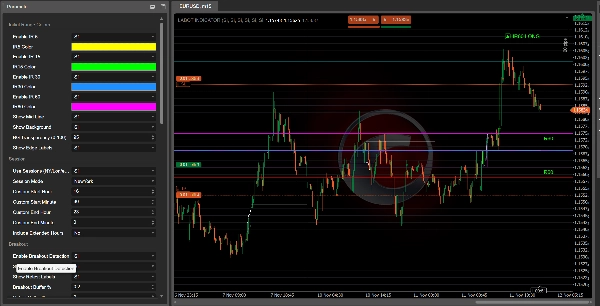
Sobald eine Spanne abgeschlossen ist, sucht der Indikator nach einem Ausbruch des Preises aus dieser Spanne:
- Ausbruch über das IR High → IR60 LONG, IR30 LONG usw.
- Ausbruch unter das IR Low → IR60 SHORT, IR30 SHORT usw.
Diese Labels erscheinen im Chart, damit Sie schnell sehen können, welche Initial Range das Signal erzeugt hat.
Filter und Bestätigungen
Der Indikator ist so konzipiert, dass er zufällige Ausbrüche durch die Kombination mehrerer Filter vermeidet:
- Trendfilter
Sie können verwenden: -
- VWAP
- EMA
- Benutzerdefinierte EMA-Länge
- VWAP + EMA zusammen
Ausbrüche in Trendrichtung werden bevorzugt (zum Beispiel LONG nur, wenn der Preis über VWAP/EMA liegt).
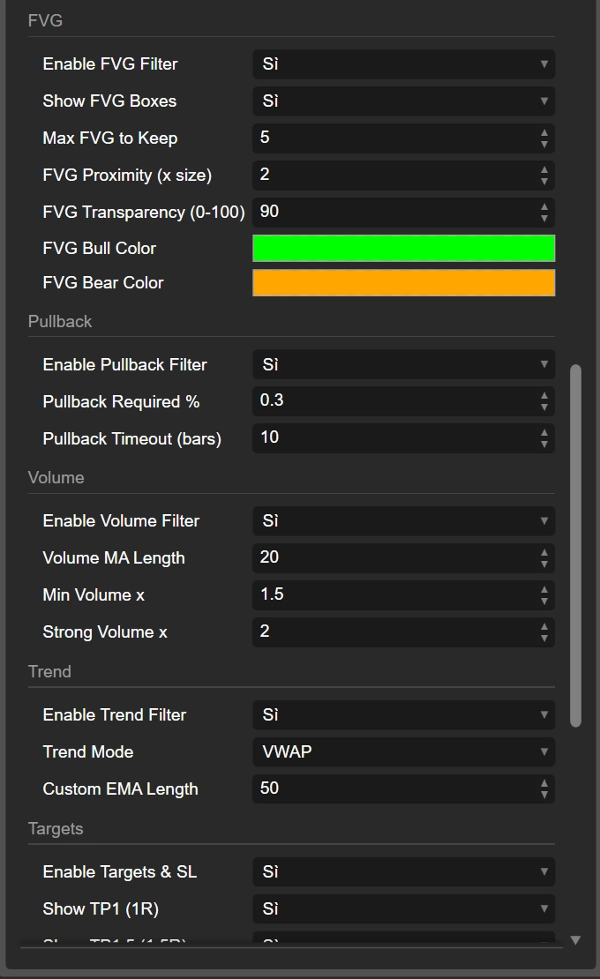
- Volumenfilter
Der Indikator vergleicht das aktuelle Volumen mit einem gleitenden Durchschnitt des Volumens: -
- „normale“ Bestätigung
- „starkes“ Volumen
Ausbrüche mit schwachem Volumen können bei Bedarf ignoriert werden.
- FVG (Fair Value Gap) Filter
Er erkennt bullische und bärische FVGs und kann verlangen, dass der Ausbruch in der Nähe eines relevanten FVGs stattfindet: -
- Bullisches FVG nahe IR High unterstützt LONG
- Bärisches FVG nahe IR Low unterstützt SHORT
- Pullback-Filter
Sie können einen Mindest-Pullback nach dem Ausbruch und ein Zeitfenster (in Bars) für diesen Pullback verlangen. Dies hilft Ihnen, sich auf Ausbrüche zu konzentrieren, die tatsächlich „atmen“, bevor sie fortsetzen.
Ausbrüche, Retests und gescheiterte Ausbrüche
Nach einem Ausbruch aus der Initial Range verfolgt der Indikator, was der Preis als nächstes macht:
- Er zählt wie viele Bars außerhalb der Spanne bleiben.
- Er prüft, ob der Preis weit genug entfernt ist (Mindestabstand in %).
- Dann beobachtet er einen Retest zurück in die Spanne.
Sie können sehen:
- IR60 LONG / IR60 SHORT (Ausbruch)
- Retest LONG / Retest SHORT Labels, wenn der Preis nach einer starken Bewegung zurückkommt
- Failed LONG / Failed SHORT Labels, wenn ein Ausbruch schnell scheitert und der Preis ohne Commitment wieder in die Spanne zurückkehrt.
Dies gibt Ihnen drei Arten von Informationen:
- sauberer Ausbruch
- gesunder Ausbruch mit Retest
- falscher/gescheiterter Ausbruch
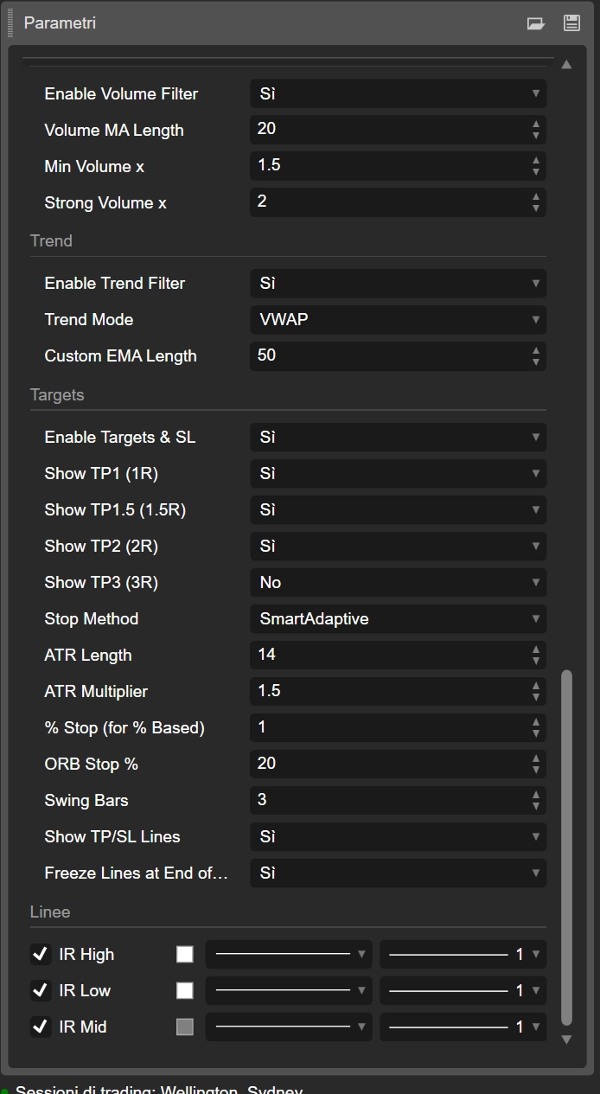
Ziele, Stop Loss und Trade-Visualisierung
Der Indikator berechnet auch automatische TP- und SL-Level basierend auf:
- ATR
- % der IR-Breite
- feste % Stops
- Swing-Punkte
- „smarte“ adaptive und skalierte ATR-Modi
Vom Einstiegspreis und Stop-Level aus berechnet er mehrere Ziele:
- TP1 (1R)
- TP1.5 (1.5R)
- TP2 (2R)
- TP3 (3R)
Sie können wählen, welche Ziele angezeigt werden sollen.
Linien werden im Chart gezeichnet:
- IR_ENTRY_LONG / IR_ENTRY_SHORT
- IR_SL_LONG / IR_SL_SHORT
- IR_TP1 / IR_TP1.5 / IR_TP2 / IR_TP3
Wenn der Preis ein Ziel oder Stop erreicht, wird der Status aktualisiert und die Linien können entweder nach dem letzten TP oder am Tagesende „eingefroren“ werden, je nach Ihren Einstellungen.
Kurz gesagt
- Alter Name: ORB (Opening Range Breakout)
- Neuer Name: IR (Initial Range) – dasselbe Konzept, sauberere Benennung
- Es erstellt Früh-Sitzungs-Spannen (IR5, IR15, IR30, IR60)
- Es markiert LONG / SHORT Ausbrüche, Retests und gescheiterte Ausbrüche
- Es verwendet Trend-, Volumen-, FVG- und Pullback-Filter zur Qualitätsverbesserung
- Es zeichnet Einstieg, Stop und mehrere Ziele direkt im Chart
Wenn Sie also „IR60 LONG“ im Chart sehen, betrachten Sie im Grunde einen Opening Range Breakout der ersten 60 Minuten der Sitzung – nur mit einem moderneren, anpassbaren Namen und viel zusätzlicher Logik dahinter.
Zusammenfassung
The indicator marks breakout signals when price moves above the range high (LONG) or below the range low (SHORT), displaying corresponding labels on the chart. It also tracks retests and failed breakouts, distinguishing clean breakouts, healthy retests, and fake moves.
To improve signal quality, the indicator incorporates multiple filters: trend filters using VWAP and EMA, volume filters comparing current volume to averages, Fair Value Gap (FVG) filters detecting bullish or bearish imbalances near breakout levels, and pullback filters requiring minimum retracements after breakouts.
Additionally, it calculates and plots automatic entry, stop loss, and multiple take profit levels based on ATR, percentage of the initial range width, fixed percentages, swing points, and adaptive ATR modes. These visual aids help traders manage risk and targets directly on the chart.
The Initial Range indicator supports various markets including Forex, stocks, indices, commodities, and cryptocurrencies, and is designed to enhance breakout trading strategies with customizable parameters and comprehensive trade visualization.
Kundenbewertungen
5 | 100 % | |
4 | 0 % | |
3 | 0 % | |
2 | 0 % | |
1 | 0 % |


