Beschreibung
Marketplace Pitch (kurz)
Volume Delta & CVD — Aggressiven Flow in Echtzeit lesen. Flexible Resets (Tag/Woche/Monat), optionale EMA-Glättung und nicht-neuzeichnendes kumulatives Delta. Perfekt zur Bestätigung von Ausbrüchen und zum Erkennen von Divergenzen.
Volume Delta & CVD — Überprüfung & Parameteranleitung
Slogan: Messen Sie das Kauf-/Verkaufsungleichgewicht (Delta) und dessen kumulativen Fluss (CVD) mit flexiblen Resets. Nicht-neuzeichnend.
Überblick
Volume Delta & CVD für cTrader berechnet pro Bar das Delta (aggressives Kaufen vs. Verkaufen) und das CVD (Kumulatives Volumen-Delta). Es hilft Ihnen, den Order-Flow-Druck zu lesen, Ausbrüche zu bestätigen und Divergenzen gegenüber dem Preis zu erkennen.
Hinweis: Der Indikator verwendet TickVolume (cTrader-Standard) als Volumenproxy.
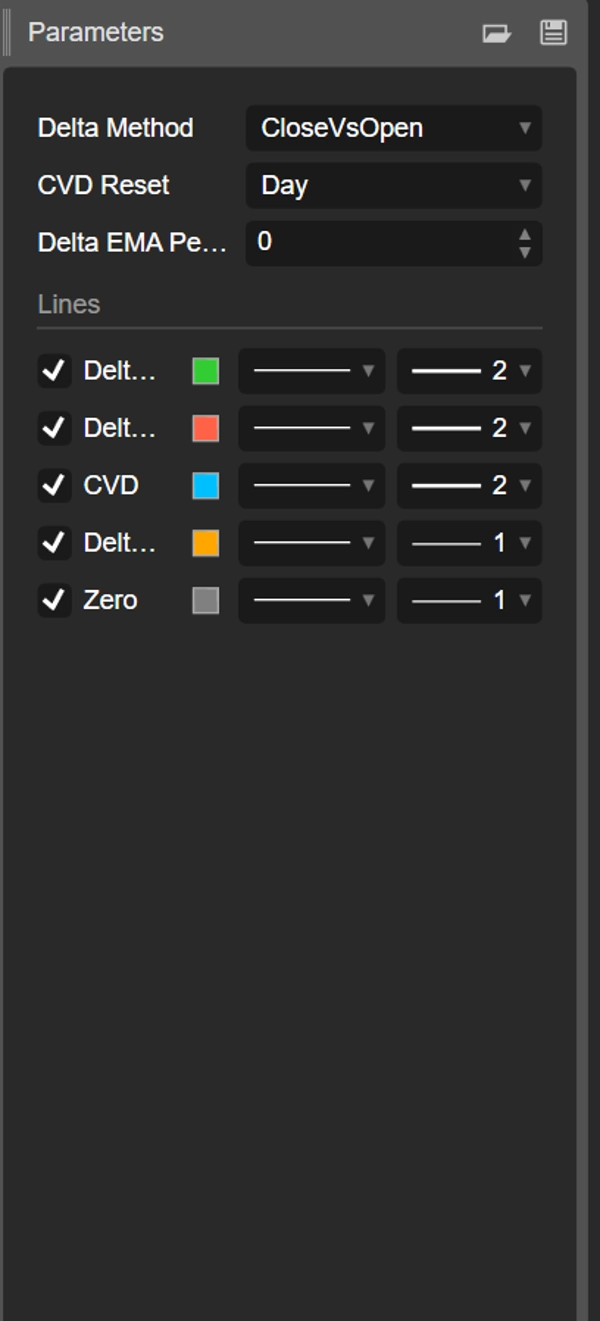
Parameter (detailliert)
Delta-Methode
Wählen Sie, wie der Richtungsfluss der Bar geschätzt wird:
- CloseVsPrevClose
Delta = ±TickVolume abhängig von Close[t] vs Close[t-1].
Vorteile: sehr reaktionsschnell; ideal für Intraday-Regimewechsel. - CloseVsOpen
Delta = ±TickVolume abhängig von Close vs Open der gleichen Bar.
Vorteile: hebt Richtungsbars hervor; reduziert Rauschen zwischen Bars. - Money Flow Multiplier (MFM)
MFM = ((Close−Low) − (High−Close)) / (High−Low)in [−1, +1]
Delta = MFM × TickVolume
Vorteile: intra-bar Gewichtung; glatt/robust bei großen Spannen.
CVD-Reset
Steuert, wann der kumulative Zähler neu startet:
- Keine: kontinuierlich ab Chartbeginn.
- Tag: setzt bei jedem neuen Tag zurück (Intraday-Bias).
- Woche: setzt bei jeder neuen Woche zurück (Swing).
- Monat: setzt bei jedem neuen Monat zurück (Bias auf höheren Zeitrahmen).
Delta EMA Periode (0 = aus)
- Wendet eine EMA auf Delta an, um das Histogramm zu glätten und Regimewechsel sichtbar zu machen.
- Vorschläge: 5–9 für Scalping, 10–21 Intraday, 21–34 Swing.
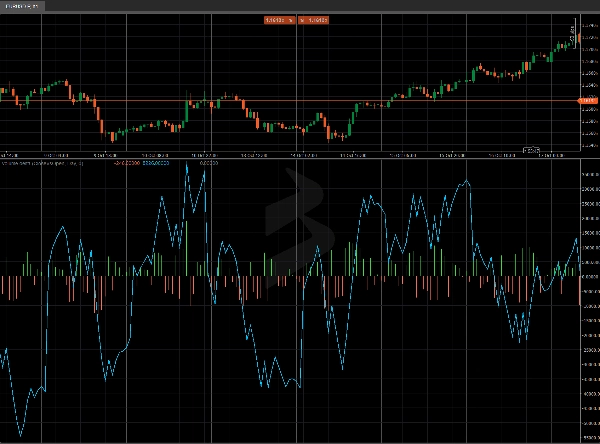
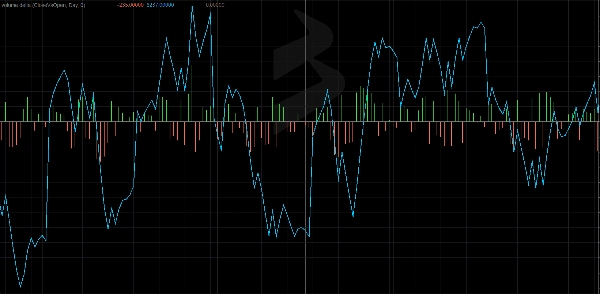
Ausgaben / Puffer
- Delta Up (grünes Histogramm): positiver Delta-Anteil.
- Delta Down (rotes Histogramm): negativer Delta-Anteil.
- CVD (türkisfarbene Linie): kumulative Summe des Delta mit dem gewählten Reset.
- Delta EMA (orange Linie, optional): geglättetes Delta.
- Null (graue Linie): Basislinie für schnellen Vergleich.
Wie man es liest
- Delta > 0 → aggressive Kauf Dominanz in der Bar.
- Delta < 0 → aggressive Verkauf Dominanz in der Bar.
- Steigendes CVD → Akkumulation; fallendes CVD → Distribution.
- Divergenzen
-
- Der Preis macht höhere Hochs, während CVD dies nicht bestätigt → mögliche Erschöpfung des Kaufdrucks.
- Der Preis macht niedrigere Tiefs, während CVD dies nicht bestätigt → mögliche Erschöpfung des Verkaufsdrucks.
Praktische Spielbücher
- Ausbruchbestätigung: bevorzugen Sie Long-Ausbrüche, wenn CVD beschleunigt und Delta EMA positiv wird.
- Abklingende Extensions: suchen Sie nach Preis- vs. CVD-Divergenzen an Schlüsselstellen (VWAP/Anchored VWAP, S/R).
- Sitzungsbias: mit CVD Reset = Tag lesen Sie die dominante Intraday-Richtung.
Schnellstart
- Fügen Sie den Indikator hinzu.
- Beginnen Sie mit Delta-Methode = MFM, CVD Reset = Tag, EMA = 10 (Intraday).
- Bei verrauschten Charts erhöhen Sie die EMA oder wechseln zu CloseVsOpen.
- Suchen Sie nach Übereinstimmung mit Anchored VWAP, statischem/dynamischem S/R oder Preisaktionsmustern.
Leistung & Kompatibilität
- Moderne APIs (
Bars.*,LineColor). - Nicht-neuzeichnende Berechnungen.
- Funktioniert bei jedem Symbol und Zeitrahmen.
Zusammenfassung
The indicator supports three Delta calculation methods: CloseVsPrevClose (responsive for intraday shifts), CloseVsOpen (reduces noise by focusing on directional bars), and Money Flow Multiplier (MFM) which weights intra-bar volume for smoother results. An optional Exponential Moving Average (EMA) smoothing can be applied to Delta to highlight regime changes.
Outputs include separate histograms for positive and negative Delta, the CVD line, an optional Delta EMA line, and a zero baseline for reference. Traders can use the indicator to confirm breakouts, identify divergences between price and volume flow, and assess order-flow pressure. It works on any symbol and timeframe, supporting markets such as Forex, indices, commodities, stocks, and cryptocurrencies.


![„[Stellar Strategies] MARSI Signal Plotter“-Logo](https://cdn.ctrader.com/image/webp/7b2b8da6-8f8e-4646-8d4a-4710c516c01e_25567)