
Breakout channel
Indikator
525 downloads
Version 1.0, Nov 2025
Windows, Mac
Beschreibung
Breakout-Kanäle
Was es macht
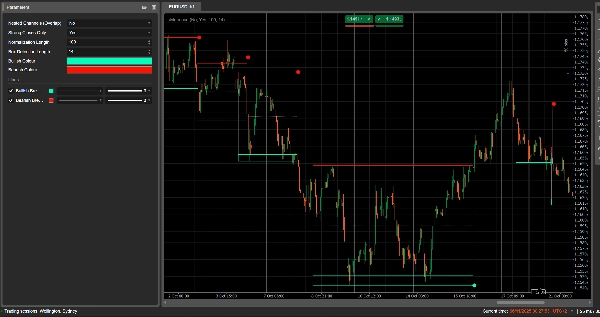
Breakout-Kanäle erkennen automatisch Konsolidierungsbereiche (Preis-“Boxen”) und markieren Ausbruchspunkte, wenn der Preis diese Bereiche verlässt.
Es zeichnet:
- Eine graue Kanalbox um die Konsolidierungszone
- Ein rotes oberes Band (potenzieller Widerstand)
- Ein grünes unteres Band (potenzielle Unterstützung)
- Eine weiße gepunktete Mittellinie (Kanalmittelpunkt)
- Farbige Punkte, wenn ein Ausbruch stattfindet:
-
- Grüner/cyanfarbener Punkt unterhalb der Box → bullischer Ausbruch
- Roter Punkt oberhalb der Box → bärischer Ausbruch
Die Idee ist, Bereiche visuell hervorzuheben, in denen sich der Preis zusammenzieht und wo starke Bewegungen wahrscheinlich beginnen, wenn der Bereich durchbrochen wird.
Wie es berechnet wird
- Preisnormalisierung
-
- Über die letzten Normalisierungsdauer Kerzen findet es das höchste Hoch und das niedrigste Tief.
- Es normalisiert den Schlusskurs in einen Bereich von 0–1:
normalizedPrice=Close−LowestLowHighestHigh−LowestLow\text{normalizedPrice} = \frac{\text{Close} - \text{LowestLow}}{\text{HighestHigh} - \text{LowestLow}}normalizedPrice=HighestHigh−LowestLowClose−LowestLow
- Volatilitätsmaß
-
- Es berechnet die Standardabweichung des normalisierten Preises über 14 Kerzen.
- Dies ergibt eine Volatilitätsreihe, die verwendet wird, um Wendepunkte in der Marktstruktur zu erkennen.
- Obere / untere „Volatilitätslinien“
-
- Über die letzten (Box-Erkennungsdauer + 1) Kerzen findet es:
-
- die Kerze, bei der die Volatilität am höchsten war
- die Kerze, bei der die Volatilität am niedrigsten war
- Ausgehend davon, wie viele Kerzen diese Extreme zurückliegen, werden zwei synthetische Linien gebildet: Obere und Untere.
- Kreuzungen zwischen diesen Linien signalisieren potenziellen Beginn/Ende einer Kanalphase.
- Kanalstart & Dauer
-
- Wenn Untere Linie die Obere Linie nach oben kreuzt, markiert der Indikator einen potenziellen Kanalstart.
- Ab dieser Kerze verfolgt er die Dauer und das höchste Hoch / niedrigste Tief im Zeitraum.
- Kanalbildung
-
- Wenn später Obere Linie wieder über die Untere Linie kreuzt und die Dauer größer als 10 Kerzen ist:
-
- Definiert er das Kanal-Obere als das höchste Hoch in diesem Zeitraum.
- Definiert er das Kanal-Untere als das niedrigste Tief.
- Misst er den aktuellen ATR/2, um eine dünne Zone oben und unten abzutrennen:
-
- Rotes Band oben (bärisches Band)
- Grünes Band unten (bullisches Band)
- Es zeichnet:
-
- Graues Umrissrechteck (gesamter Kanal)
- Rote obere Umrisslinie
- Grüne untere Umrisslinie
- Eine gepunktete weiße Mittellinie durch die Mitte
- Kanäle bleiben als historische Struktur im Chart (sie werden nach dem Ausbruch nicht gelöscht).
- Ausbruchserkennung
-
- Für jeden aktiven Kanal berechnet es bei jeder neuen Kerze einen Referenzpreis:
-
- Wenn Nur starke Schlusskurse = wahr → wird der Mittelpunkt des Kerzenkörpers verwendet:
refPrice=(Open+Close)/2\text{refPrice} = (\text{Open} + \text{Close})/2refPrice=(Open+Close)/2
Dies erfordert, dass mehr als die Hälfte des Körpers außerhalb der Box liegt. - Wenn Nur starke Schlusskurse = falsch → wird der einfache Schlusskurs verwendet.
- Wenn Nur starke Schlusskurse = wahr → wird der Mittelpunkt des Kerzenkörpers verwendet:
- Ausbruchregeln:
-
- Wenn
refPrice > Top→ bullischer Ausbruch -
- Zeichnet einen grünen Punkt am Kanal-Boden.
- Deaktiviert diesen Kanal (stoppt seine Erweiterung), aber die Box bleibt sichtbar.
- Wenn
refPrice < Bottom→ bärischer Ausbruch -
- Zeichnet einen roten Punkt am Kanal-Top.
- Deaktiviert den Kanal.
- Andernfalls bleibt der Kanal aktiv und seine rechte Kante wird bis zur aktuellen Kerze verlängert.
- Wenn
- Option für verschachtelte Kanäle
-
- Wenn Verschachtelte Kanäle = wahr, können mehrere Kanäle zeitlich und preislich überlappen.
- Wenn falsch, blockiert der Indikator die Erstellung eines neuen Kanals, der mit einem bestehenden überlappen würde.
Wie man es liest und verwendet
- Graue Box (Kanal)
-
- Stellt eine Konsolidierungs- / Gleichgewichtszone dar, in der der Preis eine Weile gehandelt wurde.
- Je länger und höher die Box, desto bedeutender der Bereich.
- Rotes oberes Band (Widerstandszone)
-
- Der obere Teil des Kanals, visuell hervorgehoben als potenzieller Widerstandsbereich.
- Wiederholte Ablehnungen in der Nähe dieses Bandes deuten auf Verkaufsdruck innerhalb des Bereichs hin.
- Grünes unteres Band (Unterstützungszone)
-
- Der untere Teil des Kanals, hervorgehoben als potenzielle Unterstützung.
- Wiederholte Abpraller deuten darauf hin, dass Käufer die untere Begrenzung des Bereichs verteidigen.
- Weiße gepunktete Mittellinie
-
- Der Mittelpunkt des Kanals – eine Art lokaler „fairer Wert“.
- Preisschwankungen um diese Linie zeigen Gleichgewicht an; starke Bewegungen weg davon gehen oft einem Test des gegenüberliegenden Bandes voraus.
- Ausbruchspunkte
-
- Grüner Punkt unterhalb der Box:
-
- Der Preis hat stark über dem oberen Ende des Kanals geschlossen (oder einfach darüber, abhängig von Nur starke Schlusskurse).
- Deutet auf einen bullischen Ausbruch hin – potenzieller Beginn einer Aufwärtsbewegung nach einer Volatilitätsverengung.
- Roter Punkt oberhalb der Box:
-
- Der Preis hat stark unter dem unteren Ende des Kanals geschlossen.
- Deutet auf einen bärischen Ausbruch hin – potenzieller Beginn einer Abwärtsbewegung.
- Typische Verwendungsweisen (Ideenebene)
-
- Trendfolgende Ausbrüche
-
- Handeln Sie in Richtung des Ausbruchs (kaufen nach grünem Punkt, verkaufen nach rotem Punkt), idealerweise in Übereinstimmung mit dem Trend höherer Zeitrahmen oder anderen Indikatoren.
- Filter & Bestätigung
-
- Verwenden Sie den Kanal und seinen Ausbruch nur als Filter für Ihre bestehende Strategie (z. B. nur Long-Setups, wenn das letzte Signal ein bullischer Ausbruch war).
- Risiko-Positionierung
-
- Bei bullischen Ausbrüchen platzieren viele Trader Stops innerhalb oder knapp unter dem ehemaligen Kanal; bei bärischen Ausbrüchen innerhalb oder oberhalb der Box.
Zusammenfassung
KI-Zusammenfassung
Breakout Channels is a technical indicator designed to identify consolidation zones and signal potential price breakouts. It automatically detects price ranges where the market is coiling, marking these with a grey channel box that highlights the consolidation area. The indicator draws a red upper band indicating potential resistance, a green lower band indicating potential support, and a white dotted midline representing the channel midpoint or local fair value.
Breakout points are signaled by colored dots: a green or cyan dot below the box indicates a bullish breakout, while a red dot above signals a bearish breakout. The indicator calculates these zones by normalizing price data, measuring volatility through the standard deviation of normalized prices, and identifying volatility extremes to define channel start and duration.
Channels remain visible on the chart as historical structures even after breakouts. Users can enable nested channels to allow overlapping consolidation zones. Breakout detection uses either candle body midpoints or close prices, depending on settings, to confirm strong closes outside the channel.
Typical uses include trading in the breakout direction, filtering existing strategies, and placing risk stops near channel boundaries. The indicator supports various markets including forex, indices, commodities, stocks, and cryptocurrencies.
Indikatorprofil
Kundenbewertungen
0.0
Bewertungen: 0
Kundenbewertungen
Bisher gibt es keine Bewertungen für dieses Produkt. Haben Sie es schon ausprobiert? Dann können Sie die erste Person sein, die andere darüber informiert!
Diskussion
Häufig gestellte Fragen (FAQ)
Signal
Indices
Commodities
GBPUSD
RSI
Bollinger
Fibonacci
Scalping
AI
XAUUSD
NAS100
MACD
BTCUSD
Forex
Breakout
EURUSD
NZDUSD
Martingale
Prop
ZigZag
Supertrend
Fair Value Gap
SMC
Crypto
Grid
Stocks
ATR
USDJPY
VWAP
Über den cTrader Store verfügbare Produkte, einschließlich Handelsbots, Indikatoren und Plugins, werden von externen Entwicklern bereitgestellt und nur zu Informations- und technischen Zugriffszwecken verfügbar gemacht. cTrader Store ist kein Broker und erbringt keine Anlageberatung, persönlichen Empfehlungen oder eine Garantie für zukünftige Performance.


![„[Stellar Strategies] Market Session Ultimate“-Logo](https://cdn.ctrader.com/image/webp/61ffd537-0125-4246-9e72-42eca1791d64_28232)
Preis
42.11M
Gehandeltes Volumen
6.13M
Pip-Gewinn
230
Verkäufe
8.52K
Kostenlose Installationen