„Volume Bubble“-Logo
Indikator
632 downloads
Version 1.0, Nov 2025
Windows, Mac
4.0
Bewertungen: 1
In „Volume Bubble“ hochgeladenes Bild
42.1M
Gehandeltes Volumen
6.13M
Pip-Gewinn
161
Verkäufe
6.64K
Kostenlose Installationen

Volume Bubbles – cTrader Custom Indicator

Volume Bubbles ist ein leichtgewichtiges, aber leistungsstarkes visuelles Indikator für cTrader, das Kerzen mit außergewöhnlichem Volumen direkt im Kurschart hervorhebt.

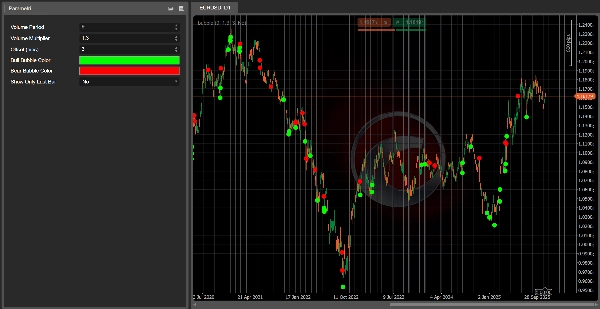
Anstatt das Volumenhistogramm anzustarren und zu versuchen zu erraten, welche Balken wirklich wichtig sind, erkennt dieses Tool automatisch, wenn das Volumen der aktuellen Kerze deutlich höher als der jüngste Durchschnitt ist, und zeichnet eine Blase (Kreis-Symbol) auf diesem Balken:

  • Für bullische Kerzen wird eine Blase unterhalb des Tiefs der Kerze gezeichnet.
  • Für bärische Kerzen wird eine Blase oberhalb des Hochs der Kerze gezeichnet.


Dies macht es extrem einfach, potenzielle klimaktische Bewegungen, Bereiche mit starkem Interesse großer Akteure oder mögliche Erschöpfungspunkte im Trend zu erkennen.

Hauptmerkmale

  • ✅ Erkennt Kerzen mit hohem Volumen mithilfe eines gleitenden Durchschnitts des Tick-Volumens
  • ✅ Zeichnet klare Blasen im Chart (kein zusätzliches Unterfenster erforderlich)
  • ✅ Unterschiedliche Farben für bullische und bärische Volumenspitzen
  • ✅ Einstellbarer Versatz in Pips, um die Blasen vom Kerzenkörper zu positionieren
  • ✅ Option, Blasen nur auf der neuesten Kerze anzuzeigen (für den Echtzeithandel)


Eingaben / Parameter

  • Volumenperiode – Anzahl der Balken, die für den gleitenden Durchschnitt des Volumens verwendet werden.
  • Volumenmultiplikator – Wie viel mal über dem durchschnittlichen Volumen ein Balken liegen muss, um eine Blase auszulösen.
  • Versatz (Pips) – Abstand zwischen der Blase und dem Hoch/Tief der Kerze.
  • Farbe der Bull-Blase – Farbe der Blasen bei bullischen Kerzen.
  • Farbe der Bear-Blase – Farbe der Blasen bei bärischen Kerzen.
  • Nur letzte Kerze anzeigen – Wenn wahr, werden Blasen nur auf der aktuellen Live-Kerze angezeigt.


Anwendung

Fügen Sie Volume Bubbles zu Ihrem Chart hinzu und verwenden Sie es als visuellen Filter, um:

  • Ausbrüche zu bestätigen, die von starkem Volumen unterstützt werden
  • mögliche Umkehrungen oder Erschöpfungskerzen
  • Zonen zu identifizieren, in denen große Akteure aktiv sein könnten

Es ist kein eigenständiges Handelssystem, aber ein ausgezeichnetes Begleitwerkzeug für jede Preisaktions- oder Trendfolgestrategie, die Wert auf Volumen legt.


👉 Hier beitreten: Algotrendit Volume Bubbles

Im Server findest du:

  • Support für diesen und andere cBots/Indikatoren
  • Strategiediskussionen und Optimierungsideen
  • Updates, Neuigkeiten und zukünftige Tools, die ich veröffentliche


Indikatorprofil
4.0
Bewertungen: 1
5
0 %
4
100 %
3
0 %
2
0 %
1
0 %
Kundenbewertungen
November 24, 2025
Volume Bubble highlights candles with significantly high volume by drawing bubbles right on the price chart - simple, clever, and efficient. Great for spotting potential climactic moves, blow-offs, or breakout confirmation without diving into separate volume windows. Just remember: context matters. Alerts and built-in stats would make it even better.
Signal
Indices
Commodities
GBPUSD
RSI
Bollinger
Fibonacci
Scalping
AI
XAUUSD
NAS100
MACD
BTCUSD
Forex
Breakout
EURUSD
NZDUSD
Martingale
Prop
ZigZag
Supertrend
Fair Value Gap
SMC
Crypto
Grid
Stocks
ATR
USDJPY
VWAP
Über den cTrader Store verfügbare Produkte, einschließlich Handelsbots, Indikatoren und Plugins, werden von externen Entwicklern bereitgestellt und nur zu Informations- und technischen Zugriffszwecken verfügbar gemacht. cTrader Store ist kein Broker und erbringt keine Anlageberatung, persönlichen Empfehlungen oder eine Garantie für zukünftige Performance.

Mehr von diesem Autor

Indikator
AI
ATR
+27
Read aggressive flow in real time. Flexible resets (Day/Week/Month), optional EMA smoothing, and non-repainting cumulati
cBot
AI
ATR
+27
The Prop-Ready Bot The Definitive Automaton for Challenges 🛡️ V2.0
Indikator
AI
Grid
+17
Editions: Free (core VWAP + bands) · Pro (multi‑VWAP, click‑to‑anchor, alerts).
cBot
AI
ATR
+21
A price-action-first algorithm to trade Breakout, Approach, and Return around prior High/Low levels—with Prop-style risk
Indikator
AI
ATR
+27
Want a cBot based on this indicator? Contact us!
cBot
AI
ATR
+27
AILevelTrader — Multi-AI Consensus Trading Bot 11 AI providers. One consensus. Prop Firm Ready.
1.9
Gewinnfaktor
4%
Maximaler Rückgang
cBot
AI
ATR
+27
N.B.: Results with an initial invested capital of 100 euros.
cBot
AI
ATR
+27
The Elliott Wave Pro Bot is a sophisticated and highly configurable algorithmic trading system
Indikator
Prop
Forex
+15
ZigZag Free is a clean swing-detection tool that marks significant pivot highs/lows
cBot
AI
ATR
+8
Breakout scalping with prop-firm grade equity control.
Indikator
AI
ATR
+27
Breakout Channels automatically detects consolidation ranges and highlights when price breaks out of them.
cBot
AI
ATR
+27
✅ Buy 3 prop accounts and manage just 1: cut management effort by 66% with a professional tool.

Das könnte Sie auch noch interessieren

Indikator
MACD
Prop
+14
Customize the MACD! Choose colors, get real-time tick updates, and see crossover points for enhanced trading precision.
Indikator
ATR
Key Levels
It combines the trend-filtering power of Renko charts with the volatility tracking of ATR Bands
Indikator
Prop
VWAP
+13
Rolling VWAP with dynamic or fixed time window, customizable source price and standard deviation bands.
Indikator
AI
ATR
+20
Buy and Sell Signals
Indikator
AI
ATR
+26
Exploit market imbalances with auto FVG zones—fade, extend, and filter with precision.
Indikator
AI
RSI
+7
EMA MTF TREND PRO - Multi-timeframe trend analysis overlay indicator, 6 timeframes - in one table with ADX
Indikator
ATR
Channel
+5
This fifth indicator is highly visual and focused on Supply and Demand zones
Indikator
Indices
Multi-Timeframe ADX Trend Dots & Arrows
Indikator
ATR
Prop
+7
An indicator that redefines ATR by applying a percentile-based filter giving traders a grounded view of volatility.
Indikator
AI
ATR
+27
VolumeProfileSuite is an advanced and flexible Volume Profile indicator for cTrader.
Indikator
Channel
Key Levels
+1
Trend channel + price forecast + automatic support & resistance zones Knows where the price is going.
Indikator
SMC
Prop
+12
SMC Pro Suite: OBs, FVGs, Structure, Liquidity, Killzones & MTF overlay. Every concept in one cTrader indicator.
Indikator
RSI
VegaXLR's cTrader StochRSI identifies overbought/oversold RSI levels for precise trade entries.
Indikator
Forex
BTCUSD
+10
🎯Smart Signals : Auto Buy/Sell alerts with dynamic TP/SL algorithm. 💡
Indikator
Market Structure
Stop guessing which trading session you in, with Sessions indicator sessions are in your finger tips like a pro
Indikator
Supertrend
Liquidity Grab
+1
Auto Detect Session Indicator Trend for Intraday Trading
Indikator
BOS
Key Levels
+2
SMC (Smart Money Concept) Confluence Indicator
Indikator
Prop
Forex
+4
Personal trade tracker for a single symbol. Clear net profit summary — FreshNet, ManageNet, DayNet, WTDNet, MTDNet.
42.1M
Gehandeltes Volumen
6.13M
Pip-Gewinn
161
Verkäufe
6.64K
Kostenlose Installationen