
Beschreibung
🏆 Über 10.000 Trader vertrauen auf unsere 25+ Algorithmus-Suite! 🏆
Von Marktstruktur & Liquidität bis intelligente Ausstiegssysteme & prädiktive Werkzeuge - wir haben JEDES Werkzeug gebaut, das Sie für Konsistenz benötigen.
👉 Zugriff auf alle 25+ BEWÄHRTEN Systeme:
_______________________________________________
📌 Marktstruktur-Indikatoren
· ✅ AdvancedMarket Structure: Bos, Choch, SwinLevels, Order Blocks, Market Structure& Liquidity Finder
· 🔄 Dynamische Marktstrukturanalyse von Wendepunkten
· 🧱 Order Block
· ⚖️ Marktungleichgewicht
· ⛓️ BOS & CHOCH
· 🧠 ICT Power of 3
_______________________________________________
🔚 Intelligente Ausstiegssysteme
· 📍 Trailing Smart Algorithmus
_______________________________________________
📐 ZigZag-Indikatoren
· 🔍 ZigZag Preis-Liquiditätsprojektion
· ➖ ZigZag
· 🎯 Zig-Zag Extremitäten-Tracker
_______________________________________________
🧱 Support- & Resistance-Indikatoren
· 🟩 SmartTrend Support- & Resistance-Linien
· 🧱 Alle Support- und Resistance-Level
_______________________________________________
📊 Trend- & Kanalindikatoren
· 🔄 Auto-Trend-Kanal
· 📊 Supertrend
_______________________________________________
💧 Volumen- & Liquiditätswerkzeuge
_______________________________________________
⚡ Momentum- & RSI-Indikatoren
· 🚀 Dynamisches Range Momentum
· 🔎 Multi-Level Candle Bias
Tracker
_______________________________________________
🔮 Prognose- & Projektionswerkzeuge
· 📐 Prognose basierend auf Linreg & ATR
· 📏 Fibonacci Lineare Regression Multi-Timeframe
· 📈 Volumengetriebener Marktfluss-Projektor_________________________
_________________________________________________________________________________________________
_________________________________________________________________________________________________
ZigZag Structure Pro – 🚀
Identifiziert automatisch die bedeutenden Wendepunkte des Marktes (wichtige Hochs und Tiefs) und zeichnet dynamische Unterstützungs- und Widerstandszonen, die sich in Echtzeit aktualisieren. 🎯 Im Gegensatz zu traditionellen statischen Levels passt sich dieser Indikator ständig der sich ändernden Preisstruktur an.
Wozu dient er? ❓
Dieser Indikator ist ein professionelles Werkzeug für die technische Analyse, das dazu entwickelt wurde:
- Institutionelle Levels identifizieren: 🏛️ Erkennt automatisch Punkte, an denen der Preis wichtige Hoch- und Tiefstrukturen gebildet hat.
- Marktstrukturanalyse: 📊 Klassifiziert jede Bewegung gemäß der bullischen/bärischen Strukturmethodik (Higher Highs, Lower Lows usw.).
- Trendprojektion: 🔮 Verlängert Trendlinien in die Zukunft, um potenzielle Preisreaktionszonen vorherzusagen.
- Handel mit Umkehrungen und Fortsetzungen: 💰 Die markierten Levels dienen als Referenz für Einstiege, Stop-Loss und Gewinnziele.
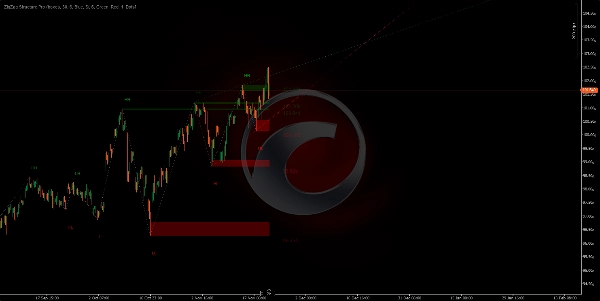
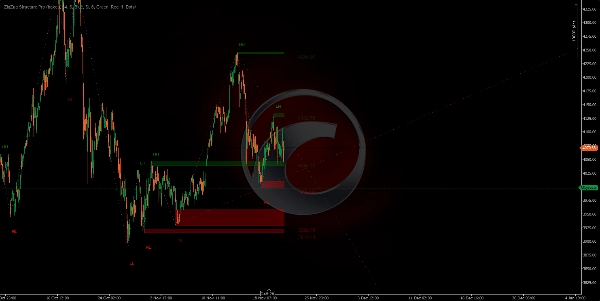
Der Indikator zeichnet in Ihrem Chart: ✍️
1. Unterstützungs-/Widerstandszonen (Rechtecke)
- Grüne Zonen: 🟢 Markieren Unterstützungsbereiche (bedeutende Tiefs, an denen der Preis abprallen könnte).
- Rote Zonen: 🔴 Markieren Widerstandsbereiche (bedeutende Hochs, an denen der Preis zurückgehen könnte).
- Diese Zonen werden nach vorne projiziert, um die aktuell aktiven Levels zu zeigen.
- Die Dicke jeder Zone repräsentiert den Kerzenkörper, in dem der Pivot gebildet wurde.
https://chartshots.spotware.com/c/691f5a4d75ac4
https://chartshots.spotware.com/c/691f6b4f2e98b
https://chartshots.spotware.com/c/691f6c6fda808
https://chartshots.spotware.com/c/691f6d0aa6155
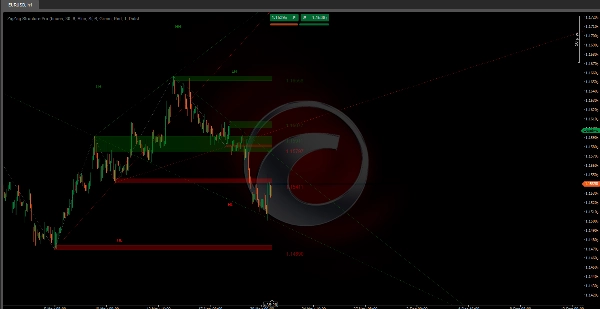
2. Verbindungslinien ⚡
- Verbindet jeden Pivot mit dem nächsten und erzeugt so ein visuelles "Zickzack"-Muster.
- Eliminiert Marktrauschen und zeigt nur die wirklich bedeutenden Bewegungen.
- Ermöglicht es, die Richtung und Struktur des Trends auf einen Blick zu erkennen.
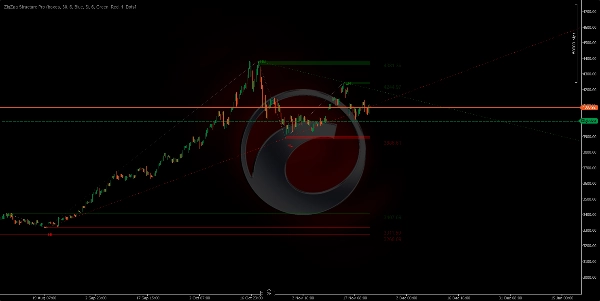
3. Projektierte Trendlinien (Erweiterte Grün/Rot)
- Gezeichnet vom vorherigen Pivot zum aktuellen und in die Zukunft verlängert.
- Grün: 🟢 Bullische Trendlinien (von Tiefs).
- Rot: 🔴 Bärische Trendlinien (von Hochs).
- Zeigt die 2 neuesten und aktiven Trendlinien.
- Nützlich zum Erkennen von Trendbrüchen oder -respekten.
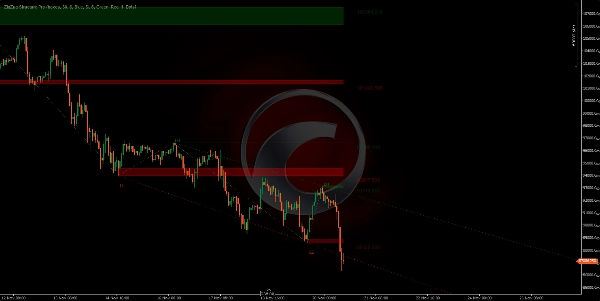
4. Marktstruktur-Labels 🏷️
Jeder Pivot zeigt ein Label, das seine Klassifikation angibt:
- HH (Higher High): ↗️ Höheres Hoch - Bullische Fortsetzung.
- LH (Lower High): ⬆️ Niedrigeres Hoch - Mögliche bärische Umkehr.
- HL (Higher Low): ⬇️ Höheres Tief - Mögliche bullische Umkehr.
- LL (Lower Low): ↘️ Niedrigeres Tief - Bärische Fortsetzung.
Logik hinter dem Algorithmus 🧠
Der Indikator verwendet einen adaptiven Zigzag-Algorithmus, der:
- Den Preis scannt und nach Hochs und Tiefs innerhalb eines konfigurierbaren Zeitraums sucht (Standard 34 Bars).
- Unbedeutende Bewegungen filtert durch eine Mindestabweichungsschwelle (Standard 6 Pips).
- Jeden Pivot validiert und sicherstellt, dass er eine echte Veränderung der Marktstruktur darstellt.
- Strukturen zwischen aufeinanderfolgenden Pivots vergleicht, um die Art der Bewegung zu klassifizieren.
- Die Zonen dynamisch aktualisiert wenn neue Pivots erscheinen und die ältesten entfernt.
Haupteinstellungen ⚙️
- Pivot Lookback Bars: Steuert die Empfindlichkeit des Pivot-Detektors (niedriger = mehr Pivots, höher = nur wichtige Pivots).
- Preisabweichungsfilter: Rauschfilter - Bewegungen kleiner als dieser Wert werden ignoriert.
- Maximale sichtbare Zonen: Anzahl der historischen Levels, die sichtbar bleiben (von 1 bis 20).
- Zonentyp-Anzeige: Wahl zwischen Rechtecken (volle Zonen) oder einfachen Linien.
- Erweiterte Trendlinien anzeigen: Trendprojektionen aktivieren/deaktivieren.
Kurzanleitung Parameter 📖
Pivot Lookback Bars (Standard: 30)
- ↑ Erhöhen (40-100): WENIGER Pivots, wichtiger. Für Swing Trading.
- ↓ Verringern (15-25): MEHR Pivots, mehr Signale. Für Scalping/Day Trading.
Preisabweichungsfilter (Standard: 6)
- ↑ Erhöhen (8-15): Filtert Rauschen, nur große Bewegungen. Weniger Signale, höhere Qualität.
- ↓ Verringern (2-5): Empfindlicher, erfasst kleine Bewegungen. Mehr Signale.
Maximale sichtbare Zonen (Standard: 6)
- ↑ Erhöhen (10-20): Mehr historische Levels sichtbar. Für tiefgehende Analyse.
- ↓ Verringern (2-4): Nur aktuelle Levels. Sauberes Chart.
Historisches Pivot-Limit (Standard: 200)
- ↑ Erhöhen (300-500): Mehr Historie für Berechnungen. Langzeitanalyse.
- ↓ Verringern (50-150): Nur aktuelle Struktur. Bessere Performance.
Anzahl aktiver Projektionen (Standard: 5)
- ↑ Erhöhen (5-10): Mehr projizierte Trendlinien.
- ↓ Verringern (1-2): Nur dominante Trends. Mehr Klarheit.
Erweiterte Trendlinien anzeigen (Ja/Nein)
- Aktiviert: Projeziert Trends in die Zukunft.
- Deaktiviert: Nur historisches Zickzack.
🎯 Schnelle Einstellungen
- Scalping: Lookback 15-20 | Abweichung 3-5 | Zonen 3-4
- Day Trading: Lookback 25-35 | Abweichung 6-8 | Zonen 5-6
- Swing Trading: Lookback 40-60 | Abweichung 10-15 | Zonen 8-12
Zusammenfassung
Kundenbewertungen
5 | 0 % | |
4 | 100 % | |
3 | 0 % | |
2 | 0 % | |
1 | 0 % |


