
RT Consolidation Zones
Indikator
1 käufe
Version 1.0, Sep 2024
Windows, Mac
Beschreibung
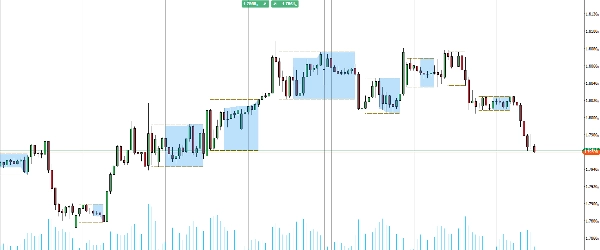
Wir stellen den Consolidation Zones Indikator vor, der Ihnen hilft, Ausbruchsgelegenheiten einfach zu erkennen und zu nutzen.
Dieses leistungsstarke Tool hebt Zonen in Ihrem Chart hervor, in denen sich der Preis konsolidiert, was es einfach macht, potenzielle Ausbruchspunkte zu erkennen. Durch die Visualisierung dieser kritischen Bereiche können Sie Marktbewegungen besser antizipieren und fundiertere Handelsentscheidungen treffen.
Ideal für Trader, die ihre Strategie mit klaren und umsetzbaren Erkenntnissen verbessern möchten, erweitern Sie Ihr Trading-Toolkit und meistern Sie Ausbrüche mit dem Consolidation Zones Indikator.
Zusammenfassung
Indikatorprofil
Kundenbewertungen
0.0
Bewertungen: 0
Kundenbewertungen
Bisher gibt es keine Bewertungen für dieses Produkt. Haben Sie es schon ausprobiert? Dann können Sie die erste Person sein, die andere darüber informiert!
Diskussion
Häufig gestellte Fragen (FAQ)
BTCUSD
Forex
Breakout
Indices
EURUSD
Commodities
GBPUSD
NZDUSD
Prop
Crypto
Stocks
XAUUSD
NAS100
USDJPY
Über den cTrader Store verfügbare Produkte, einschließlich Handelsbots, Indikatoren und Plugins, werden von externen Entwicklern bereitgestellt und nur zu Informations- und technischen Zugriffszwecken verfügbar gemacht. cTrader Store ist kein Broker und erbringt keine Anlageberatung, persönlichen Empfehlungen oder eine Garantie für zukünftige Performance.


Preis
Seit 25/09/2024
20
Verkäufe