
คำอธิบาย
Dot Momentum %BB Dynamic Visualizer สำหรับ cTrader
วัดความผันผวน แสดงภาพโมเมนตัม ควบคุมการเข้าตลาดของคุณ
ปลดปล่อยพลังของความผันผวนด้วย Bollinger Bands %B Dynamic Visualizer ตัวบ่งชี้ที่ออกแบบเฉพาะสำหรับ cTrader เพื่อให้คุณเข้าใจการเคลื่อนไหวของราคาเทียบกับซองความผันผวนได้อย่างลึกซึ้ง ตัวบ่งชี้นี้ก้าวข้าม Bollinger Bands แบบดั้งเดิม โดยเปลี่ยนเมตริกความผันผวนที่ซับซ้อนให้เป็นสตรีมวงกลมที่มีสีสันเข้าใจง่าย ช่วยให้คุณระบุจุดเปลี่ยนตลาดและความแข็งแกร่งของแนวโน้มได้อย่างแม่นยำ
Bollinger Bands %B คืออะไรและแตกต่างอย่างไร?
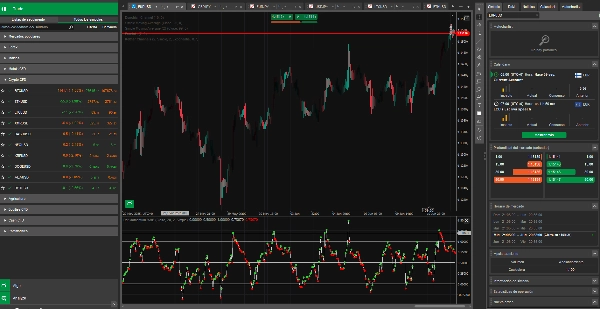
ในขณะที่ Bollinger Bands มาตรฐานจะแสดงทับบนกราฟราคาโดยตรง แสดงการสนับสนุน/ต้านทานแบบไดนามิกและแสดงภาพความผันผวนของตลาดผ่านการขยายและหดตัว Bollinger Bands %B เป็นออสซิลเลเตอร์ ซึ่งแสดงในแผงแยกด้านล่างกราฟหลักของคุณ ให้ มาตรวัดเชิงปริมาณ ว่าราคาปัจจุบันอยู่ที่ใด ภายใน ซองของ Bollinger Bands
มันไม่ได้แสดงราคาตรงๆ แต่แสดงตำแหน่งสัมพัทธ์ของราคาบนสเกลตั้งแต่ 0 ถึง 1:
- 0.0: ราคาที่เส้น Bollinger Band ล่าง
- 0.5: ราคาที่เส้น Bollinger Band กลาง (ค่าเฉลี่ยเคลื่อนที่)
- 1.0: ราคาที่เส้น Bollinger Band บน
ประโยชน์และบริบทของความผันผวน:
ตัวบ่งชี้นี้ไม่ได้เป็นเพียงการสังเกตเท่านั้น แต่ยังวัดตำแหน่งของราคาเทียบกับความผันผวนโดยธรรมชาติของมัน ช่วยให้คุณ:
- วัดความแข็งแกร่งของแนวโน้ม: %B ที่สูงกว่า 0.5 อย่างต่อเนื่องบ่งชี้โมเมนตัมขาขึ้นที่แข็งแกร่ง ขณะที่ต่ำกว่า 0.5 บ่งชี้แรงกดดันขาลง
- ระบุการกลับตัวที่เป็นไปได้: ค่าที่สุดขีด (ใกล้ 0.0 หรือ 1.0) สามารถบ่งชี้ว่าราคาถูกขยายเกินไปในช่วงความผันผวนปัจจุบัน
- เข้าใจบริบทของความผันผวน: ความผันผวนเอง (แสดงโดยความกว้างของ Bollinger Bands พื้นฐาน) จะ ขึ้นอยู่กับบริบท ของกรอบเวลาที่คุณดู ค่าของ %B บนกราฟ 1 ชั่วโมงจะแสดงความผันผวนแตกต่างจากกราฟ 1 วัน ตัวบ่งชี้ของเราปรับตัวได้อย่างราบรื่นตามกรอบเวลาที่เลือก ให้ข้อมูลเชิงลึกที่เกี่ยวข้อง
คุณสมบัติทางเทคนิค:
- การคำนวณที่แม่นยำ: %B คำนวณจาก: (ราคาปัจจุบัน−เส้นล่าง)/(เส้นบน−เส้นล่าง)
- การเข้ารหัสสีแบบไดนามิก (วงกลม):
-
- วงกลมสีเขียวมะนาว: แสดงว่าค่า %B กำลังเพิ่มขึ้นจากแท่งก่อนหน้า สัญญาณโมเมนตัมขาขึ้น
- วงกลมสีแดง: แสดงว่าค่า %B กำลังลดลงจากแท่งก่อนหน้า สัญญาณโมเมนตัมขาลง
- วงกลมสีเงิน: แสดงเมื่อค่า %B ไม่เปลี่ยนแปลงหรือสำหรับจุดที่ถูกต้องแรกสุด
- เส้นทางที่ละเอียดอ่อน: เส้นสีเทาอ่อนบางๆ ติดตามเส้นทางโดยรวมของค่า %B อย่างละเอียด ให้ความต่อเนื่องทางสายตาใต้วงกลมไดนามิก
- เครื่องหมายระดับที่ไม่เด่นชัด: เส้นสีเทาเข้มทึบที่ 0.0, 0.5 และ 1.0 (มองเห็นได้ง่ายโดยไม่บดบังภาพหลัก) ให้จุดอ้างอิงชัดเจนสำหรับความสุดขีดของความผันผวนและค่าเฉลี่ย
- ปรับแต่งได้: ปรับช่วงเวลา Bollinger Bands, ส่วนเบี่ยงเบนมาตรฐาน และประเภท MA ได้โดยตรงจากการตั้งค่า
คำอธิบายง่ายๆ: สัญญาณความผันผวนเกิน (เหมือน RSI สำหรับความผันผวน!)
คิดว่าตัวบ่งชี้นี้เหมือน RSI แต่สำหรับ ความผันผวนที่ขยายเกิน แทนที่จะเป็นระดับราคาซื้อเกิน/ขายเกินธรรมดา
- เมื่อวงกลม แตะหรืออยู่ต่ำกว่า 0.0 หมายความว่าราคากำลังดันอย่างหนักที่ด้านล่างของซองความผันผวนปัจจุบัน นี่เหมือนสัญญาณ "ความผันผวนขายเกิน" บ่งชี้ว่าตลาดอาจถูก ขยายเกินไปทางด้านลบ ภายในบริบทปัจจุบัน
- เมื่อวงกลม แตะหรืออยู่สูงกว่า 1.0 หมายความว่าราคากำลังดันอย่างหนักที่ด้านบนของซองความผันผวนปัจจุบัน นี่เหมือนสัญญาณ "ความผันผวนซื้อเกิน" บ่งชี้ว่าตลาดอาจถูก ขยายเกินไปทางด้านบวก ภายในบริบทปัจจุบัน
ค่าที่สุดขีดเหล่านี้ไม่ได้หมายความว่าให้ "ซื้อ" หรือ "ขาย" ทันที แต่เป็นการแจ้งเตือนที่ทรงพลังว่าตลาดอยู่ในจุดสุดขีดภายในช่วงการเคลื่อนไหวปกติของ กรอบเวลานั้นๆ ซึ่งมักจะนำไปสู่การกลับสู่ค่าเฉลี่ยหรือการเปลี่ยนแปลงพฤติกรรมความผันผวนของตลาด
สรุป
รีวิวจากลูกค้า
5 | 0 % | |
4 | 100 % | |
3 | 0 % | |
2 | 0 % | |
1 | 0 % |


!["Gaussian Channel [Iridio Capital]" โลโก้](https://cdn.ctrader.com/image/webp/7c039209-5573-4a54-a072-f9528b503103_41960)


!["[Hamster-Coder] Pivot Points MTF" โลโก้](https://cdn.ctrader.com/image/webp/4c143e5a-309c-40e3-a578-f04d1e133ffa_31159)