
FZ
Chỉ báo
Phiên bản 1.0, Mar 2026
Windows, Mac
4.0
Đánh giá: 2
Mô tả
Chỉ báo FZ cho cTrader
Mô tả
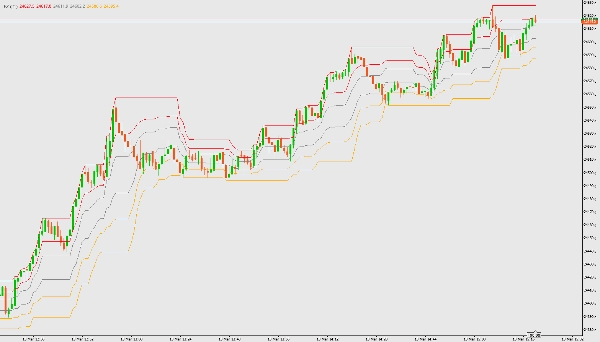
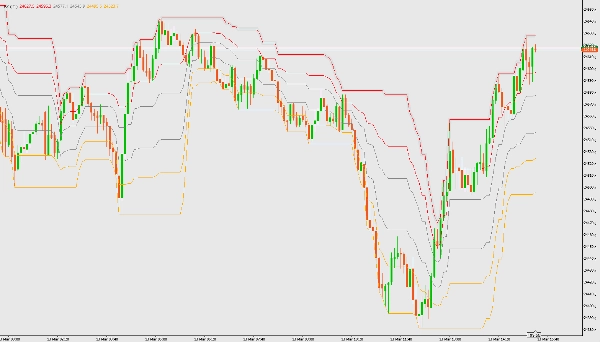
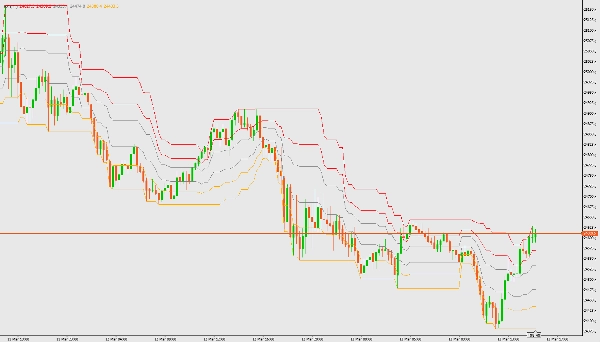
Chỉ báo FZ vẽ các vùng kênh Fibonacci dựa trên giá cao nhất và thấp nhất trong một khoảng thời gian do người dùng định nghĩa. Nó giúp xác định các vùng xu hướng và các khu vực có khả năng đảo chiều.
Tính năng
- Tính toán biên kênh và các mức Fibonacci (0.236, 0.382, 0.618, 0.786)
- Hiển thị các vùng xu hướng tăng, đi ngang và giảm
- Chồng lên biểu đồ giá
Tham số
- tính cho ## thanh cuối cùng: Số thanh để sử dụng cho việc tính toán (mặc định: 21)
Cách sử dụng
- Tải xuống và thêm tệp chỉ báo FZ (FZ.cs) vào nền tảng cTrader của bạn.
- Biên dịch chỉ báo trong cTrader Automate.
- Gắn chỉ báo vào bất kỳ biểu đồ nào.
- Điều chỉnh tham số số thanh theo nhu cầu.
- Diễn giải các vùng màu sắc:
-
- Xanh lam nhạt: Vùng xu hướng tăng (mua vào)
- Xám: Vùng đi ngang (chờ thay đổi xu hướng)
- Cam: Vùng xu hướng giảm (bán ra)
Tóm tắt
Hồ sơ chỉ báo
Đánh giá của khách hàng
4.0
Đánh giá: 2
5 | 0 % | |
4 | 100 % | |
3 | 0 % | |
2 | 0 % | |
1 | 0 % |
Thảo luận
Câu hỏi thường gặp
BTCUSD
Forex
Signal
Breakout
Indices
EURUSD
Commodities
GBPUSD
NZDUSD
Prop
Scalping
Crypto
Grid
Stocks
AI
XAUUSD
NAS100
USDJPY
Các sản phẩm có sẵn trên cTrader Store, bao gồm bot giao dịch, chỉ báo và plugin, được cung cấp bởi các nhà phát triển bên thứ ba và chỉ nhằm mục đích cung cấp thông tin và tiếp cận kỹ thuật. cTrader Store không phải là nhà môi giới và không cung cấp lời khuyên đầu tư, khuyến nghị cá nhân hay bất kỳ đảm bảo nào về hiệu suất trong tương lai.
Sản phẩm khác của tác giả này


Giá
Kể từ 10/03/2026
105
Cài đặt miễn phí