
Mô tả
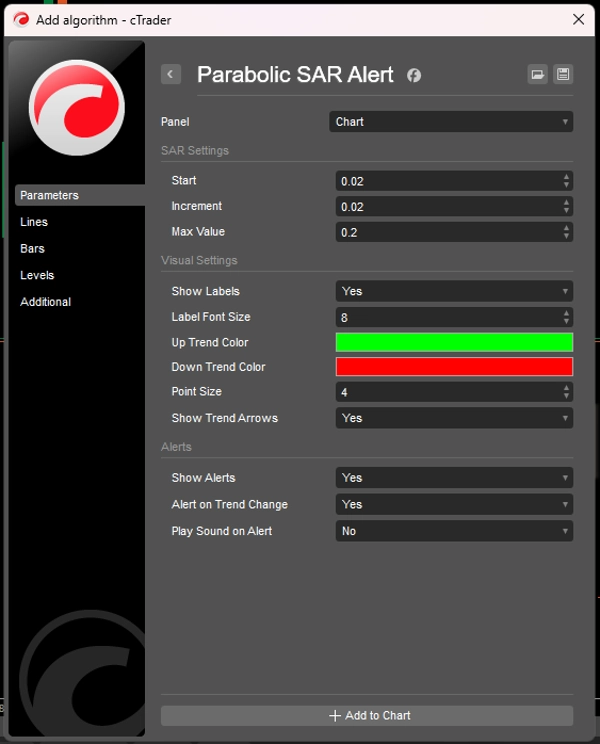
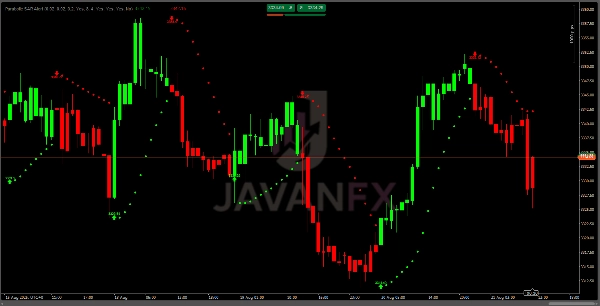
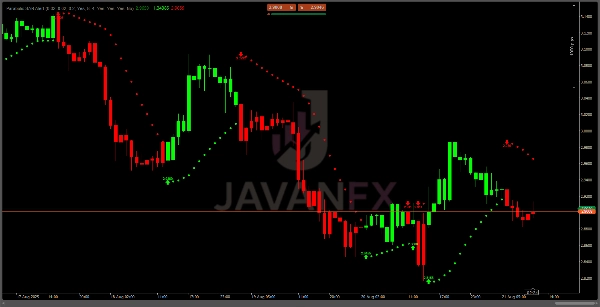
Chỉ báo này theo dõi xu hướng giá và xác định các điểm đảo chiều tiềm năng bằng cách sử dụng thuật toán Parabolic SAR nổi tiếng. Có thể tùy chỉnh với các giá trị bắt đầu, tăng dần và tối đa điều chỉnh được, nó có các tín hiệu mã màu sống động (màu xanh chanh cho xu hướng tăng, màu đỏ cho xu hướng giảm) và các nhãn tùy chọn để đánh dấu sự thay đổi xu hướng. Hoàn hảo cho forex, cổ phiếu và các thị trường khác, nó bao gồm cảnh báo tích hợp để thông báo cho bạn về sự thay đổi xu hướng, đảm bảo bạn không bao giờ bỏ lỡ một biến động quan trọng.
AI CẦN CHỈ BÁO NÀY?
- Các nhà giao dịch gặp khó khăn trong việc xác định sự thay đổi xu hướng
- Các chuyên gia muốn có tín hiệu đảo chiều đáng tin cậy
- Người mới bắt đầu tìm kiếm hướng dẫn giao dịch trực quan rõ ràng
- Các nhà giao dịch thuật toán cần điểm kích hoạt chính xác
- Bất kỳ ai mệt mỏi vì bỏ lỡ các bước ngoặt lớn của thị trường
⏰ TỐI ƯU KHUNG THỜI GIAN:
Scalping (biểu đồ 1-5 phút):
Bắt đầu: 0.01-0.015
Tăng dần: 0.015-0.02
Tối đa: 0.1-0.15
Giao dịch trong ngày (biểu đồ 15-30 phút):
Bắt đầu: 0.02-0.03
Tăng dần: 0.02-0.03
Tối đa: 0.15-0.2
Giao dịch Swing (biểu đồ 1-4 giờ):
Bắt đầu: 0.03-0.04
Tăng dần: 0.03-0.04
Tối đa: 0.2-0.25
Phân tích đa khung thời gian:
- Áp dụng chỉ báo cho khung thời gian cao hơn để xác định hướng xu hướng
- Sử dụng khung thời gian thấp hơn để xác định thời điểm vào lệnh chính xác
- Hoàn hảo cho giao dịch hội tụ
Kết hợp với:
- Đường trung bình động để xác nhận xu hướng
- RSI/MACD để xác thực động lượng
- Các mức hỗ trợ/kháng cự cho điểm vào lệnh tốt hơn
- Chỉ báo khối lượng để xác nhận sức mạnh
🚨 MẸO CHUYÊN NGHIỆP:
- Tránh thị trường biến động mạnh: SAR hoạt động tốt nhất trong điều kiện có xu hướng
- Chờ xác nhận: Đừng vào lệnh ngay khi dấu chấm đầu tiên đổi màu - hãy chờ xác nhận giá
- Sử dụng nhiều khung thời gian: Hướng SAR trên khung thời gian cao hơn xác định xu hướng chính
- Điều chỉnh tham số: Tinh chỉnh cài đặt cho các công cụ khác nhau
- Kiểm tra lại trước: Thử nghiệm chiến lược trước khi giao dịch thực tế
Chúc may mắn!!
Tóm tắt
The indicator is optimized for various timeframes: scalping (1–5 minutes), day trading (15–30 minutes), and swing trading (1–4 hours), with recommended parameter ranges for each. It supports multi-timeframe analysis, allowing traders to use higher timeframes for trend direction and lower timeframes for precise entries. The indicator can be combined with moving averages, RSI, MACD, support/resistance levels, and volume indicators for enhanced confirmation.
Intended for traders seeking clear, reliable reversal signals, it is suitable for beginners and professionals alike. Users are advised to avoid choppy markets, wait for price confirmation before entering trades, adjust parameters per instrument, and backtest strategies prior to live trading.
Đánh giá của khách hàng
5 | 100 % | |
4 | 0 % | |
3 | 0 % | |
2 | 0 % | |
1 | 0 % |


