
Series - FXMaster
Chỉ báo
3 lượt mua
Phiên bản 1.0, Jul 2025
Windows, Mac
4.6
Đánh giá: 3

Mô tả
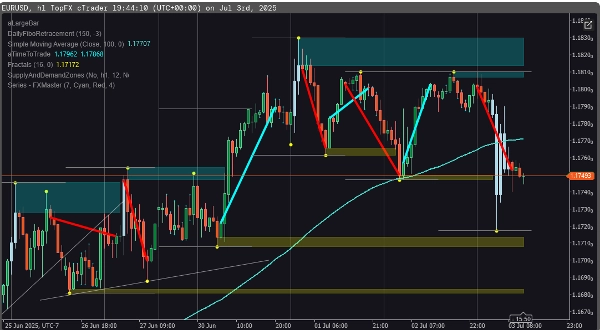
Khám phá các xu hướng có xác suất cao với độ chính xác. Bộ Đường xu hướng đa ký hiệu phát hiện chuỗi các Đỉnh Cao Hơn / Đáy Cao Hơn / Đóng Cửa Cao hoặc Đáy Thấp Hơn / Đỉnh Thấp Hơn / Đóng Cửa Thấp, mang đến cho bạn cái nhìn rõ ràng, có thể tùy chỉnh về các xu hướng tăng và giảm—trên bất kỳ ký hiệu thị trường nào.
🚀 Tính năng chính
- Phát hiện chuỗi xu hướng: Phát hiện các chuỗi tăng hoặc giảm dựa trên các mẫu cấu trúc giá liên tiếp.
- Ngưỡng có thể tùy chỉnh: Đặt số lượng thanh cần thiết để xác nhận một xu hướng hợp lệ—điều chỉnh để phù hợp với chiến lược của bạn.
- Đường xu hướng trực quan: Tự động vẽ các đường xu hướng trực tiếp trên biểu đồ của bạn—mã màu cho xu hướng tăng và xu hướng giảm.
🎯 Dành cho ai
- Nhà giao dịch hành động giá dựa vào cấu trúc và nhịp điệu hơn là các chỉ báo.
- Người theo xu hướng tìm kiếm sự xác nhận cấu trúc sớm.
- Người theo dõi đa ký hiệu cần một công cụ để quản lý tất cả.
Tóm tắt
Tóm tắt AI
The Series - FXMaster indicator identifies high-probability trends by detecting sequences of price action patterns such as Higher Highs, Higher Lows, High Closes, Lower Lows, Lower Highs, and Low Closes. It provides clear, customizable insights into uptrends and downtrends across any market symbol, including Forex, indices, commodities, cryptocurrencies, and stocks. Key features include trend sequence detection to spot bullish or bearish patterns based on consecutive price structures, customizable thresholds allowing users to set the number of bars required to confirm a trend, and automatic drawing of color-coded trendlines directly on charts for visual clarity. This tool is designed for price action traders who prioritize market structure and rhythm, trend followers seeking early confirmation of trends, and multi-symbol watchers who require a unified indicator for multiple markets.
Hồ sơ chỉ báo
Đánh giá của khách hàng
4.6
Đánh giá: 3
5 | 67 % | |
4 | 33 % | |
3 | 0 % | |
2 | 0 % | |
1 | 0 % |
Đánh giá của khách hàng
July 14, 2025
The opening read should not drive the whole decision, but it is just a support layer.
July 8, 2025
The journal has a cleaner path, but it works better with a written plan.
Thảo luận
Câu hỏi thường gặp
Forex
Indices
Commodities
Crypto
Stocks
Các sản phẩm có sẵn trên cTrader Store, bao gồm bot giao dịch, chỉ báo và plugin, được cung cấp bởi các nhà phát triển bên thứ ba và chỉ nhằm mục đích cung cấp thông tin và tiếp cận kỹ thuật. cTrader Store không phải là nhà môi giới và không cung cấp lời khuyên đầu tư, khuyến nghị cá nhân hay bất kỳ đảm bảo nào về hiệu suất trong tương lai.


![Logo "[CB] Pivot Points Pro"](https://cdn.ctrader.com/image/webp/43463c82-67b0-4f10-a4ba-901bba091d81_32594)


Giá
Kể từ 11/01/2025
19
Lượt bán