

Mô tả
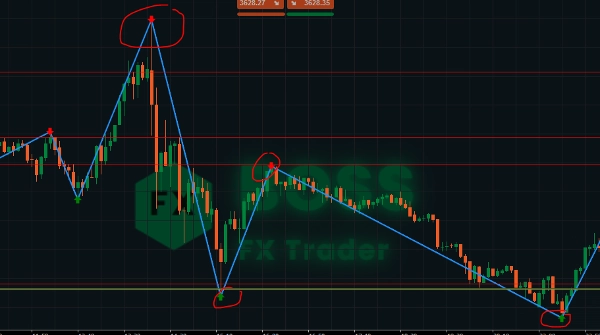
Chỉ báo ZigZag là một công cụ cấu trúc thị trường giúp lọc bỏ những biến động giá nhỏ và làm nổi bật đỉnh và đáy dao động chính. Bằng cách kết nối các điểm này bằng các đường thẳng, các nhà giao dịch có thể dễ dàng nhận biết xu hướng, sự đảo chiều và các mô hình biểu đồ.
Nó không tự tạo ra tín hiệu mua/bán, nhưng khi kết hợp với hành động giá, hỗ trợ/kháng cự hoặc các chỉ báo khác, nó trở nên mạnh mẽ cho các chiến lược scalping, giao dịch trong ngày và swing.
🔎 Các tính năng chính
- Đơn giản hóa nhiễu thị trường bằng cách hiển thị các dao động giá rõ ràng.
- Giúp xác định các mức hỗ trợ và kháng cự.
- Hữu ích để phát hiện các mô hình biểu đồ (đầu & vai, đỉnh/đáy đôi, tam giác).
- Hỗ trợ xác nhận xu hướng và vào lệnh khi giá hồi.
- Chỉ báo Mũi tên Bán và Mua
⚡ Scalping với ZigZag
- Khung thời gian: 1m – 5m
- Mục tiêu: Bắt các biến động nhỏ nhưng thường xuyên.
- Cách sử dụng:
-
- Chờ hình thành đỉnh/đáy dao động mới.
- Đánh dấu những điểm này như hỗ trợ hoặc kháng cự vi mô.
- Vào lệnh khi phá vỡ hoặc giá hồi đến các mức ZigZag này.
- Giữ stop-loss ngay ngoài đỉnh/đáy dao động cuối cùng (rủi ro chặt chẽ).
- Mục tiêu lợi nhuận nhanh (5–15 pip tùy biến động).
👉 Hoạt động tốt nhất trong các phiên có biến động cao (mở cửa London / New York).
⏱️ Giao dịch trong ngày với ZigZag
- Khung thời gian: 15m – 1H
- Mục tiêu: Giao dịch các xu hướng hàng ngày và các điểm đảo chiều quan trọng trong ngày.
- Cách sử dụng:
-
- Xác định xu hướng chính trong ngày bằng cách sử dụng các dao động ZigZag lớn hơn.
- Sử dụng các điểm ZigZag như vùng pivot để vào lệnh (mua khi giá giảm trong xu hướng tăng, bán khi giá tăng trong xu hướng giảm).
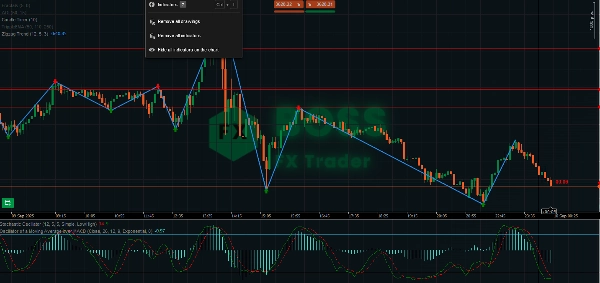
- Kết hợp với các chỉ báo dao động (RSI/Stochastic) để xác nhận vùng mua quá mức/bán quá mức gần các điểm cực ZigZag.
- Sử dụng đỉnh/đáy dao động trước đó làm mức SL/TP hợp lý.
👉 Rất phù hợp cho nhà giao dịch trong ngày muốn các biến động 20–50 pip.
📆 Giao dịch Swing với ZigZag
- Khung thời gian: 4H – Hàng ngày
- Mục tiêu: Bắt các xu hướng lớn và giao dịch vị thế.
- Cách sử dụng:
-
- Sử dụng ZigZag để xác định cấu trúc thị trường chính (đỉnh cao hơn & đáy cao hơn = xu hướng tăng).
- Vào lệnh sau các đợt hồi khi một đáy dao động mới hình thành trong xu hướng tăng.
- Đặt SL dưới đáy dao động chính cuối cùng.
- Mục tiêu lợi nhuận 2–3 lần rủi ro, hoặc mức dao động ZigZag tiếp theo.
- Dùng ZigZag để phát hiện các mô hình đảo chiều (đỉnh/đáy đôi, đầu & vai) để thoát lệnh.
👉 Lý tưởng để giữ lệnh trong vài ngày đến vài tuần.
📌 Mẹo chuyên nghiệp
- Điều chỉnh Độ sâu: Nhỏ hơn = nhạy hơn (tốt cho scalping). Lớn hơn = lọc nhiễu (tốt hơn cho swing).
- Kết hợp với khối lượng, bộ lọc xu hướng hoặc trung bình động để xác nhận.
- Luôn kiểm tra ZigZag khung thời gian cao hơn trước khi vào lệnh — các dao động nhỏ trong xu hướng lớn có thể là bẫy.
- Dùng ZigZag để xác nhận mô hình biểu đồ (tam giác, nêm).
Chúc các nhà giao dịch luôn có lợi nhuận!
Tóm tắt
Key features include simplification of market noise, identification of support and resistance levels, trend confirmation, and assistance with pullback entries. It supports multiple trading styles across various timeframes: scalping (1–5 minutes), intraday trading (15 minutes to 1 hour), and swing trading (4 hours to daily). Users can adjust the indicator’s sensitivity to suit different trading approaches and combine it with volume or moving averages for confirmation. The tool is applicable to diverse markets including Forex, indices, commodities, stocks, and cryptocurrencies, supporting symbols like EURUSD, GBPUSD, XAUUSD, NAS100, and BTCUSD.
Đánh giá của khách hàng
5 | 67 % | |
4 | 33 % | |
3 | 0 % | |
2 | 0 % | |
1 | 0 % |


