

Mô tả
1️⃣ Chỉ Báo Này Làm Gì?
Công cụ này tóm tắt hướng nến trên nhiều khung thời gian trong một vị trí trên biểu đồ của bạn.
Đối với mỗi khung thời gian, nó kiểm tra nến đóng cuối cùng và hiển thị:
Trạng tháiÝ nghĩa
🟢 Bull
Đóng > Mở (người mua kiểm soát)
🔴 Bear
Đóng < Mở (người bán kiểm soát)
⚪ Doji
Đóng ≈ Mở (do dự)
Các khung thời gian hiển thị:
- Hàng ngày
- H4
- H1
- M30
- M15
- M5
Tất cả trạng thái được hiển thị trên chính biểu đồ, vì vậy bạn không cần phải chuyển đổi khung thời gian.
2️⃣ Tại Sao Công Cụ Này Mạnh Mẽ
🔥 Giải Quyết Vấn Đề Phổ Biến Của Trader
Hầu hết các trader đều hỏi:
“Tôi đang giao dịch theo hay ngược lại xu hướng khung thời gian cao hơn?”
Chỉ báo này trả lời điều đó ngay lập tức.
Thay vì đoán mò:
- Bạn thấy sự đồng thuận xu hướng
- Bạn tránh được vào lệnh ngược xu hướng
- Bạn cải thiện thời điểm & sự tự tin
3️⃣ Cách Chỉ Báo Hoạt Động
📌 Logic Trạng Thái Nến
- Sử dụng nến đóng cuối cùng (
Last(1)) - Không vẽ lại
- Xác nhận đáng tin cậy
📌 Dữ Liệu Đa Khung Thời Gian
- Lấy dữ liệu nến thực từ mỗi khung thời gian
- Độc lập với khung thời gian biểu đồ bạn đang xem
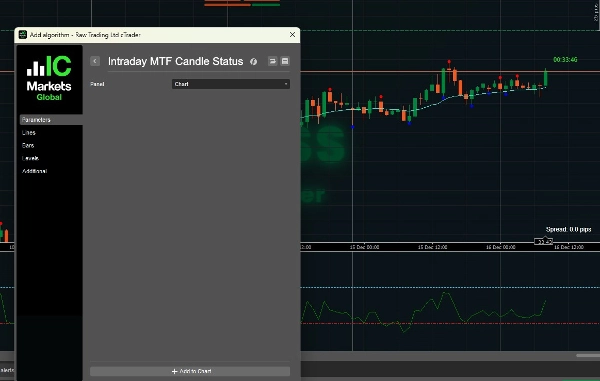
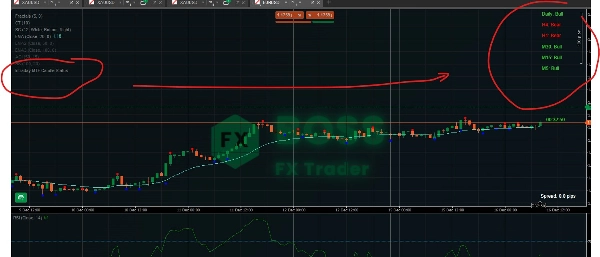
📌 Hiển Thị Trên Biểu Đồ
- Vẽ nhãn văn bản ở góc trên bên phải
- Mã màu để đọc nhanh
- Cập nhật mỗi tick
4️⃣ Cách Sử Dụng Hiệu Quả (Tình Huống Giao Dịch)
🟢 Tình Huống 1: Xác Nhận Xu Hướng (Trường Hợp Sử Dụng Tốt Nhất)
✔ Quy tắc:
Chỉ giao dịch khi các khung thời gian cao và thấp đồng thuận
Ví dụ:
Hàng ngày: Bull
H4: Bull
H1: Bull
M15: Bull
M5: Bull
✅ Môi trường MUA có xác suất cao
Sử dụng:
- Điều chỉnh giá hồi lại
- Phá vỡ
- Vào lệnh tiếp diễn
❌ Tránh BÁN ở đây
🔴 Tình Huống 2: Cảnh Báo Ngược Xu Hướng
Hàng ngày: Bull
H4: Bull
H1: Bear
M15: Bear
M5: Bear
⚠️ Thị trường đang trong giai đoạn hồi giá, không phải đảo chiều.
Hành động tốt nhất:
- Chờ M5/M15 chuyển lại thành Bull
- Tránh đuổi theo lệnh BÁN
- Tìm kiếm các thiết lập mua tại vùng hỗ trợ
⚪ Tình Huống 3: Thị Trường Nhiễu Loạn / Sideway
Hàng ngày: Bull
H4: Doji
H1: Doji
M15: Bear
M5: Bull
🚫 Điều kiện chất lượng thấp
Khuyến nghị:
- Giảm kích thước vị thế
- Tránh giao dịch phá vỡ
- Chờ sự rõ ràng của cấu trúc
5️⃣ Ví Dụ Chiến Lược Scalping (Vào Lệnh M5)
🔹 Thiết Lập Mua Lý Tưởng
- Hàng ngày → Bull
- H4 → Bull
- H1 → Bull
- M15 → Bull
- M5 → Bear → chuyển thành Bull
📍 Vào lệnh:
- Khi M5 chuyển lại thành Bull
- Kết hợp với:
-
- Hỗ trợ
- Fractals
- EMA / VWAP
🔹 Thiết Lập Bán Lý Tưởng
Logic ngược lại:
- Khung thời gian cao hơn → Bear
- Vào lệnh khi hoàn thành hồi lại M5
6️⃣ Các Kết Hợp Khung Thời Gian Tốt Nhất
Phong Cách Giao DịchKhung Thời Gian Tập Trung
Scalping
H1 → M15 → M5
Trong ngày
H4 → H1 → M15
Swing
Hàng ngày → H4 → H1
7️⃣ Công Cụ Này KHÔNG PHẢI Là
🚫 Không phải tín hiệu vào lệnh riêng lẻ
🚫 Không phải chỉ báo đảo chiều
🚫 Không thay thế cho cấu trúc / hành động giá
✅ Đây là công cụ định hướng & xác nhận
8️⃣ Các Chỉ Báo Tốt Nhất Để Kết Hợp
Các cặp kết hợp được khuyến nghị cao:
- ✅ Fractals (bạn đã sử dụng)
- ✅ Cấu trúc thị trường (HH / LL)
- ✅ Hỗ trợ & Kháng cự
- ✅ EMA 50 / EMA 200
- ✅ VWAP
9️⃣ Quy Tắc Giao Dịch Chuyên Nghiệp Sử Dụng Công Cụ Này
✔ Giao dịch chỉ theo hướng của HTF
✔ Chỉ sử dụng LTF để xác định thời điểm vào lệnh
✔ Bỏ qua tín hiệu khi Daily & H4 không đồng thuận
✔ Không giao dịch quá mức khi tín hiệu hỗn hợp
✔ Để cấu trúc xác nhận định hướng nến
🔟 Tóm Tắt Cuối Cùng
IntradyMultiTimeframeCandleStatus = Bảng Điều Khiển Định Hướng Thị Trường
Nó mang lại cho bạn:
- Sự rõ ràng xu hướng ngay lập tức
- Giao dịch có xác suất cao hơn
- Quyết định ít cảm xúc hơn
- Thực thi sạch sẽ hơn
Hãy xem sản phẩm của chúng tôi.
Tóm tắt
Đánh giá của khách hàng
5 | 100 % | |
4 | 0 % | |
3 | 0 % | |
2 | 0 % | |
1 | 0 % |


