

Descripción
📌 Detector de SESGO del Mercado — Descripción
El Detector de SESGO del Mercado es un asistente de trading inteligente diseñado para identificar si el mercado se inclina hacia un Sesgo de Compra, Sesgo de Venta, o Sesgo Neutral. Analiza para determinar la estructura dominante del mercado.
Con lógica integrada de IA, la herramienta no solo evalúa la acción del precio frente a las condiciones de tendencia, sino que también se adapta con el tiempo aprendiendo del comportamiento del mercado. Esto ayuda a filtrar señales falsas, aumenta la precisión y proporciona a los traders una dirección de mercado accionable de un vistazo.
La herramienta elimina las conjeturas mostrando un mensaje claro de sesgo en tu gráfico:
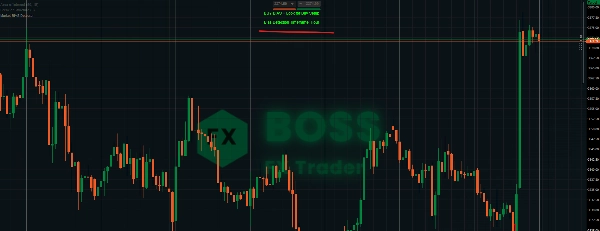
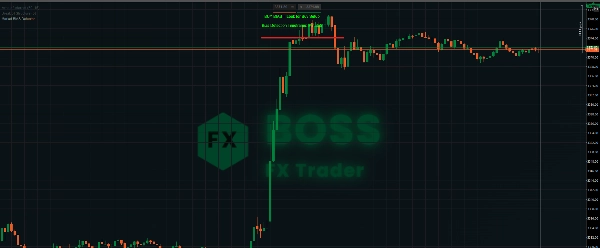
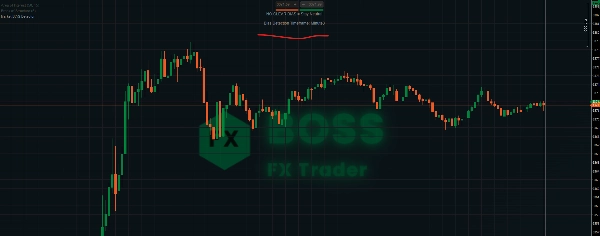
- ✅ SESGO DE COMPRA → Busca solo configuraciones de compra.
- ❌ SESGO DE VENTA → Busca solo configuraciones de venta.
- ⚪ SIN SESGO CLARO → Mantente neutral y espera confirmación.
⚙️ Cómo Usarlo
- Aplica el Indicador a tu gráfico.
-
- Una vez cargado, calculará automáticamente el sesgo.
- No se requiere entrada manual si el panel está oculto.
- Lee el Resultado:
-
- El mensaje aparecerá en el gráfico mostrando el sesgo actual del mercado (Compra, Venta o Neutral).
- También muestra el marco temporal que estás analizando, para que conozcas el contexto del sesgo.
- Estrategia de Trading:
-
- Cuando el indicador muestra SESGO DE COMPRA, planifica solo operaciones largas (configuraciones de compra).
- Cuando muestra SESGO DE VENTA, planifica solo operaciones cortas (configuraciones de venta).
- Mantente paciente durante condiciones Neutrales hasta que el sesgo se aclare.
- Confirmación Multi-Marco Temporal (Opcional):
-
- Usa el Detector de SESGO del Mercado en marcos temporales más altos (H1, H4, D1) para confirmar la dirección de la tendencia a largo plazo.
- Combínalo con entradas en marcos temporales más bajos para operaciones precisas.
🤖 Integración de IA en la Herramienta
La IA está integrada en el Detector de SESGO del Mercado de las siguientes maneras:
- Reconocimiento de Patrones: La IA ayuda a reconocer patrones de precio recurrentes para reducir cambios falsos de sesgo.
- Filtrado Adaptativo: En lugar de reglas rígidas, la IA se adapta a diferentes condiciones de mercado (tendencia, rango, volatilidad) ponderando dinámicamente las relaciones entre EMA y Hull.
- Reducción de Ruido: Analizando datos históricos, la IA filtra pequeñas fluctuaciones que podrían engañar a indicadores estándar.
- Soporte a la Decisión: La lógica de IA refina el resultado del sesgo para que los traders puedan enfocarse solo en las configuraciones de mayor probabilidad.
✨ En resumen, el Detector de SESGO del Mercado combina análisis técnico clásico y avanzado con filtrado potenciado por IA para ofrecer a los traders una herramienta confiable de dirección del mercado, reduciendo las conjeturas y mejorando la consistencia en las operaciones.
Resumen
Valoraciones de clientes
5 | 100 % | |
4 | 0 % | |
3 | 0 % | |
2 | 0 % | |
1 | 0 % |


