
Описание
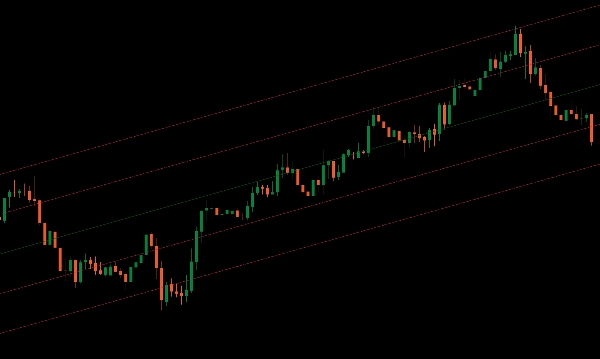
Представляем индикатор Standard Deviation Channel для cTrader — мощный инструмент, предназначенный для точной визуализации рыночных трендов.
Этот индикатор отображает медиану за заданный период на вашем графике, предоставляя центральную точку отсчёта для движений цены.
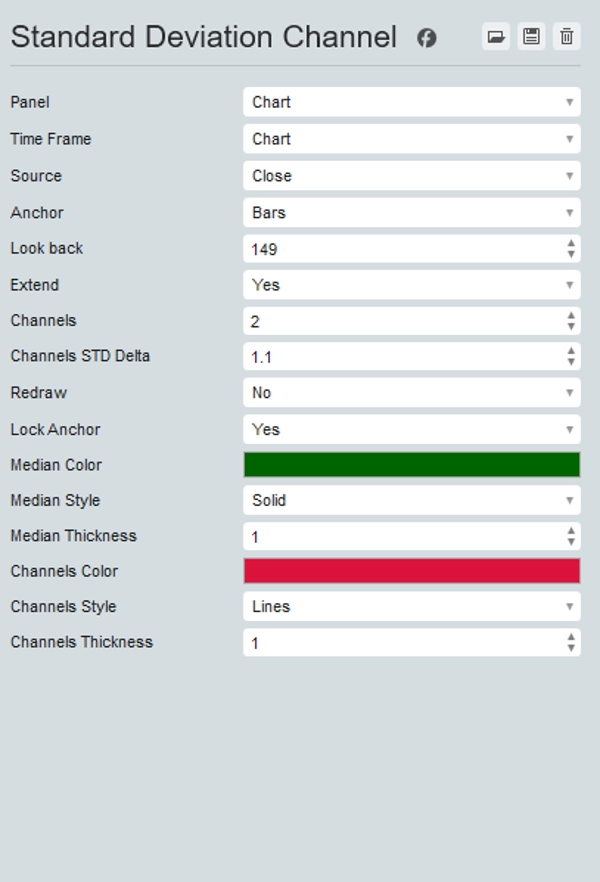
Кроме того, он позволяет добавить нужное количество верхних и нижних каналов с кратными стандартного отклонения, давая вам чёткое представление о волатильности цены и потенциальных зонах прорыва.
Идеально подходит для трейдеров, стремящихся к расширенным аналитическим возможностям, индикатор Standard Deviation Channel помогает легко определить направления тренда и возможные точки разворота.
Обновите свой торговый набор инструментов с помощью Standard Deviation Channel для более качественного анализа рынка и принятия решений.
Сводка
Отзывы покупателей
5 | 100 % | |
4 | 0 % | |
3 | 0 % | |
2 | 0 % | |
1 | 0 % |


