
Описание
💡 Каналы линейной регрессии и точки ZigZag 💡
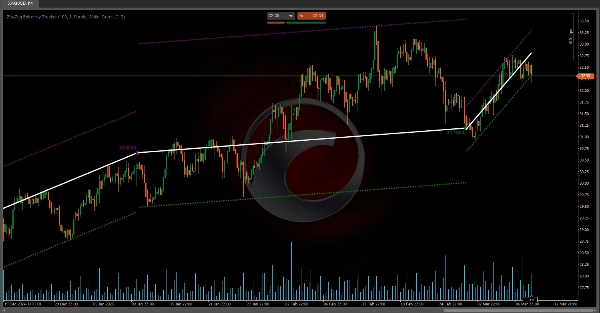
• Каналы линейной регрессии пересчитываются и сбрасываются каждый раз, когда цена выходит за ожидаемые границы (полосы), обеспечивая актуальность измерения в соответствии с реальным трендом рынка.
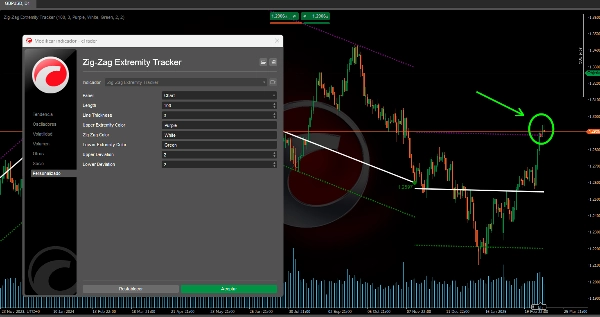
• Отмеченные точки (круги) представляют экстремумы (максимумы и минимумы), которые служат основой для построения ZigZag и определения, откуда рассчитываются каналы.
• Этот динамический подход позволяет лучше визуализировать потенциальные изменения тренда, а также области перекупленности или перепроданности, где цена может вернуться к среднему значению.
❓ Как каналы связаны с ZigZag и экстремальными точками? ❓
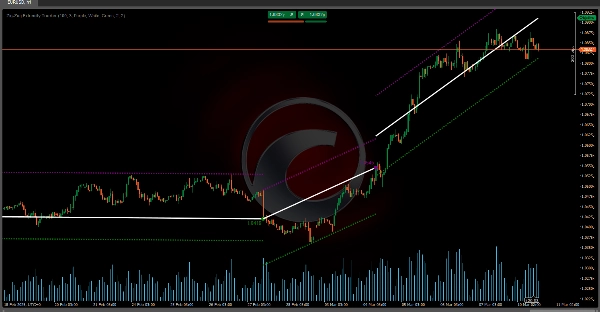
• Каждый раз, когда обнаруживается новый экстремум (максимум или минимум), индикатор не только отображает круг и линию ZigZag, соединяющую эту точку с предыдущей, но и перенастраивает потенциальный канал линейной регрессии, строящийся от этого последнего экстремума.
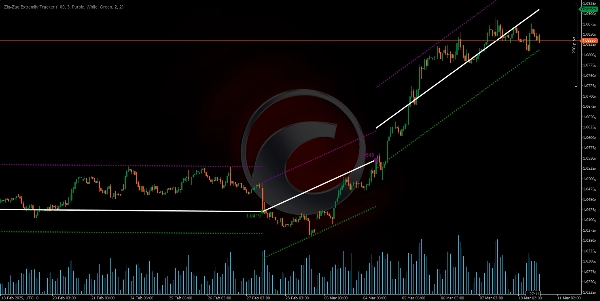
• Если в последующих барах цена остается в пределах полос, канал остается активным и продолжается до текущего бара.
• Если в какой-то момент цена пробивает эти полосы, индикатор «предполагает», что канал был аннулирован, и начинает новый канал с бара, на котором произошло пробитие.
Индикаторы из Ctrader Store:
Dynamic Market Structure
Анализ поворотных точек
Fibonacci Linear
Регрессия по нескольким таймфреймам
Multi-Level Candle Bias
Tracker
Auto Support and
Resistance Trend Lines
All Support and
Resistance Levels
Dynamic Market Structure Analysis of Turning Points
Fibonacci Linear Regression Multi-timeframe
Multi-Level Candle Bias Tracker
Auto Support and Resistance Trend Lines
Сводка
Отзывы покупателей
5 | 50 % | |
4 | 50 % | |
3 | 0 % | |
2 | 0 % | |
1 | 0 % |


