Opis
Wskaźniki Pinescriptlabs Store: Pinescriptlabs Store cBots : (cBot) Gold & BTC BreakoutSession Pivots(nowy)
Projekcja płynności ceny ZigZag
Inteligentny algorytm podążający (nowy)
Prognoza oparta na Linreg & ATR
SmartTrend wsparcie i
opór
linie
Dynamiczna
struktura rynku
Analiza
punktów
zwrotnych
Punktów zwrotnych
Fibonacci
Regresja liniowa
wieloczasowa
wieloczasowa
Wielopoziomowy
Tracker nachylenia świec
Tracker
Automatyczne
wsparcie i
opór
linie trendu
linie
Wszystkie
wsparcia i
opory
poziomy
Strefy podaży i popytu
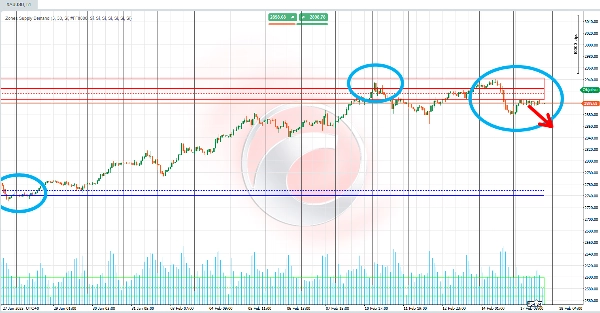
Algorytm analizuje ruch cenowy poprzez akumulację wolumenu, dzieląc widoczny zakres cenowy (od najwyższej do najniższej ceny) na wiele segmentów lub "interwałów." 📏 Dla każdego interwału oblicza wygenerowany wolumen i porównuje go z ustalonym wcześniej progiem procentowym. Cel? Zidentyfikować poziomy, gdzie koncentracja wolumenu jest tak wysoka, że sygnalizuje strefę podaży lub strefę popytu! 🎯
📉 Dla strefy podaży:
- Zacznij od najwyższej ceny i przesuwaj się w dół przez interwały.
- Akumuluj wolumen w każdym segmencie.
- Gdy zgromadzony wolumen przekracza próg, oznacza to strefę podaży 🚨.
- Kolorowy obszar (prostokąt o określonej przezroczystości) jest rysowany od tego poziomu do najwyższego, wraz z poziomymi liniami pokazującymi proste i ważone średnie ceny w tej strefie. 🖍️
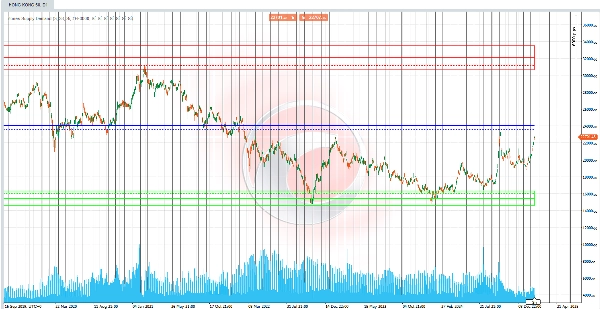
📈 Dla strefy popytu:
- Zacznij od najniższej ceny i przesuwaj się w górę przez interwały.
- Akumuluj wolumen w każdym segmencie.
- Gdy zgromadzony wolumen przekracza próg, definiuje to strefę popytu 🚨.
- Rysowany jest odpowiedni obszar wraz z liniami średnich, aby podkreślić średni poziom koncentracji. 🖌️
⚖️ Równowaga rynku:
Gdy zidentyfikowane są zarówno strefy podaży, jak i popytu, algorytm oblicza punkt równowagi rynku! 🌟 Ta równowaga jest wyprowadzana z średniej (prostej lub ważonej wolumenem) między tymi dwiema strefami. Efekt? Wyraźne linie odniesienia na wykresie pokazujące równowagę między presją kupna a sprzedaży! ⚖️✨
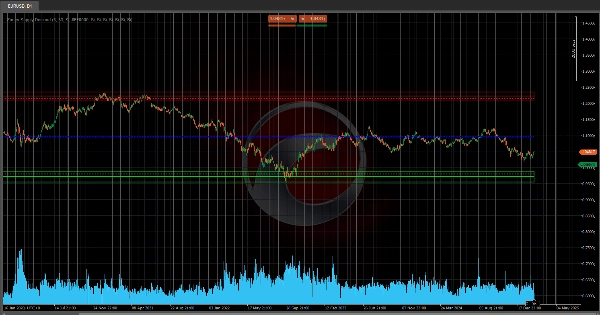
✅ Podsumowując:
Wskaźnik "Strefy podaży i popytu" wykorzystuje segmentację cenową opartą na wolumenie do wykrywania kluczowych obszarów koncentracji zleceń. 🗝️ Następnie generuje wizualne wskazówki (kolorowe strefy, linie średnich i punkty równowagi), aby podkreślić krytyczne poziomy na wykresie, umożliwiając traderom dostrzeganie nierównowagi podaży i popytu i potencjalnych punktów zwrotnych! 🚀💡
Podsumowanie
Opinie klientów
5 | 0 % | |
4 | 50 % | |
3 | 50 % | |
2 | 0 % | |
1 | 0 % |