


Penerangan
⚠️Kemas kini keluar nikmati maklumat kedalaman sebenar⚠️
🔥 PAPAN PEMUKA PETA PANAS 📈
Terminal Aliran Pesanan & Momentum Gred Institusi untuk cTrader.
The Heat Map Dashboard bukan sekadar lapisan carta asas—ia adalah ekosistem perdagangan tiga bahagian yang dibina terus ke dalam platform anda. Ia memberi anda penglihatan "X-Ray" ke dalam kecairan pasaran, purata berat volum sebenar, dan trend tahap makro, semua tanpa melambatkan komputer anda. ⚡
🎯 Apa Yang Dilakukan (Pandangan Pedagang)
Sistem ini memecahkan perdagangan anda kepada tiga langkah mudah:
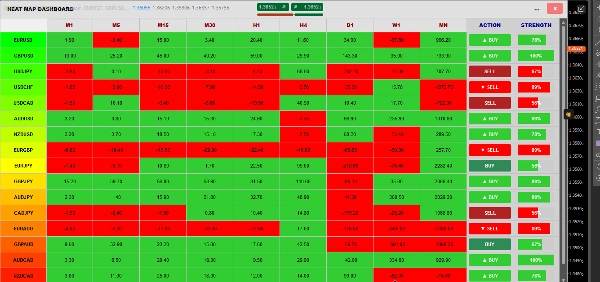
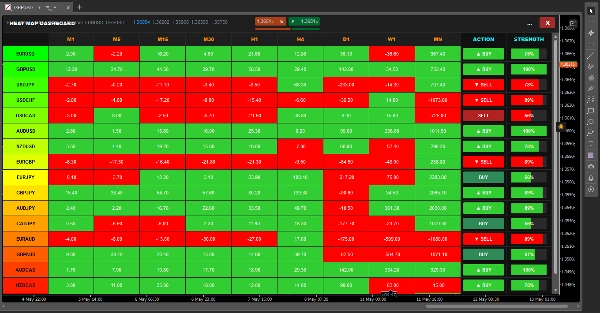
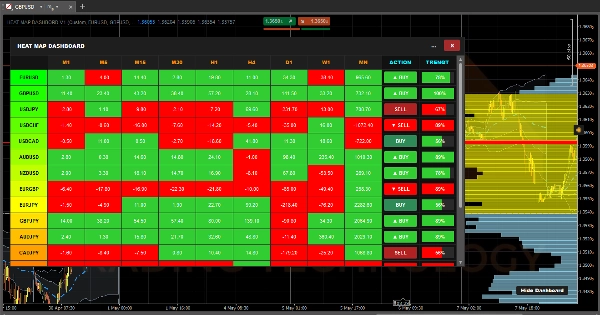
- 🎛️ Langkah 1: APA yang hendak didagangkan (The Matrix). Daripada mengklik melalui berpuluh-puluh carta, papan pemuka mengimbas 17 aset berbeza merentasi 9 jangka masa (M1 hingga Bulanan). Ia mengira momentum untuk setiap sel dan mewarnakannya. Sekilas pandang, anda tahu dengan tepat pasangan mana yang berada dalam trend besar dan bersedia untuk berdagang.
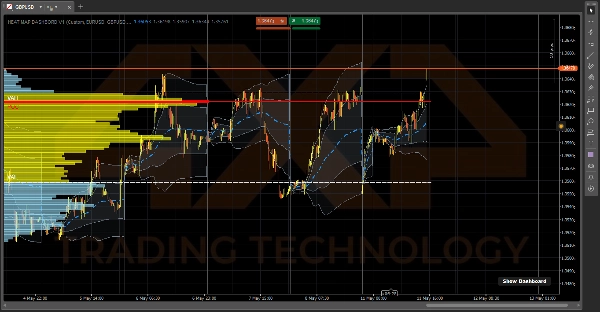
- 🌊 Langkah 2: SIAPA yang mengawal (The VWAP). Setelah anda memilih pasangan, lihat Daily Anchored VWAP. Ia menunjukkan harga purata sebenar berdasarkan volum, bukan hanya lilin. Awan Sisihan Piawai yang berbayang bertindak sebagai sokongan/rintangan dinamik, menunjukkan dengan tepat bila pasaran sangat terlebih beli atau terlebih jual.
- 📊 Langkah 3: DI MANA untuk masuk (The VRVP). Akhirnya, Visible Range Volume Profile memetakan dengan tepat di mana kecairan institusi berat berada. Ia secara automatik melukis Point of Control (POC) dan 70% Value Area (VAH & VAL) garis, memberi anda tahap tepat untuk melaksanakan kemasukan dan keluar anda.
⚙️ Bagaimana Ia Berfungsi (Di Sebalik Tabir)
Kebanyakan penunjuk yang cuba melakukan matematik sebanyak ini akan segera membekukan platform anda dan meruntuhkan cTrader kepada penggunaan CPU 100%. Untuk mengelakkan itu, Heat Map Dashboard dikuasakan oleh tiga enjin bebas yang sangat dioptimumkan yang berjalan serentak:
1. Enjin Papan Pemuka (Degupan Jantung 2 Saat) ⏱️ Jika kami mengira 153 gabungan (17 pasangan x 9 jangka masa) pada setiap tik harga, komputer anda akan cair. Sebaliknya, enjin ini berjalan pada pemasa degupan jantung 2 saat yang ketat. Setiap 2 saat, ia diam-diam melihat harga dari 14 lilin yang lalu, membandingkannya dengan harga semasa, dan mewarnakan sel Hijau (momentum positif) atau Merah (momentum negatif).
2. Enjin VRVP (Pembaca Skrin) 🖥️ Daripada memuatkan ribuan bar data sejarah, Profil Volum bertindak sebagai "Pendengar Pandangan" dinamik. Ia hanya aktif apabila anda secara fizikal mengezum atau menatal carta anda. Ia bertanya kepada cTrader lilin mana yang sedang kelihatan di skrin anda, mengira pertindihan volum tepat untuk bar tersebut, dan segera melukis semula Kawasan Nilai 70%.
3. Enjin VWAP (Pengumpul Tik) 🧮 VWAP adalah satu-satunya yang mengira pada tik langsung. Namun, untuk mengekalkannya pantas, ia menggunakan "Siri Data Kumulatif" ringan. Daripada mengira semula keseluruhan hari setiap saat, ia hanya menambah volum tik baru ke jumlah latar belakang yang berjalan, dan secara automatik membersihkan dirinya tepat pada milisaat jam menunjukkan tengah malam.
4. Pengurus Tetingkap (Pengubah Bentuk) 🪟 Papan pemuka dibalut dalam logik saiz C# khusus yang secara aktif mendengar monitor anda. Apabila anda menekan Maksimum [ ] atau Pulihkan [=] butang, penunjuk secara dinamik membaca Chart.Width dan Chart.Height anda secara masa nyata, serta-merta mengubah bentuk untuk muat skrin anda dengan sempurna tanpa runtuh!
Ringkasan
1. Market Momentum Matrix: Scans 17 assets across 9 timeframes (from 1 minute to monthly), calculating and color-coding momentum to identify trending pairs quickly.
2. Daily Anchored Volume Weighted Average Price (VWAP): Displays true average prices weighted by volume, with dynamic standard deviation clouds indicating overbought or oversold conditions.
3. Visible Range Volume Profile (VRVP): Maps institutional liquidity by highlighting the Point of Control (POC) and 70% Value Area (VAH & VAL) within the visible chart range, aiding precise entry and exit levels.
The dashboard operates via four optimized engines: a 2-second heartbeat engine for momentum updates, a viewport-driven VRVP engine for volume profile recalculations, a tick-accumulating VWAP engine for real-time volume-weighted pricing, and a dynamic window manager that adjusts the interface to fit the chart size. This architecture ensures efficient performance and real-time responsiveness. The indicator supports visualization, signals (including trend strength, breakouts, and reversals), and filtering based on tick data, volume, and market structure analysis. It is tagged for aggressive trading, market structure, liquidity sweeps, support/resistance, and risk dashboard functionalities.
Ulasan pelanggan
5 | 67 % | |
4 | 33 % | |
3 | 0 % | |
2 | 0 % | |
1 | 0 % |
Perbincangan
Soalan Lazim
Lebih banyak produk daripada penulis ini


























Harga