present
Daftar dan dapatkan potongan bernilai $50 untuk pembelian pertama anda
Trading product for Smart Price Action Concepts Indikator Fair Value Gap Order Block, image 1
Smart Price Action Concepts
Indikator
Versi 1.1, Oct 2026
Windows, Mac
Trading product for Smart Price Action Concepts Indikator Fair Value Gap Order Block, image 2
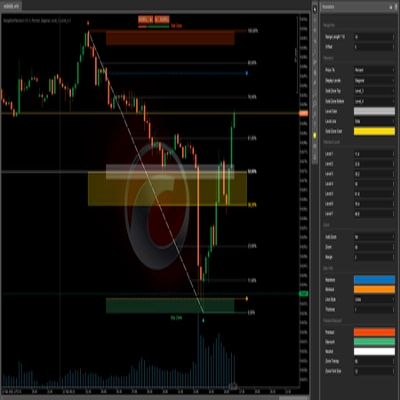
Trading product for Smart Price Action Concepts Indikator Fair Value Gap Order Block, image 3
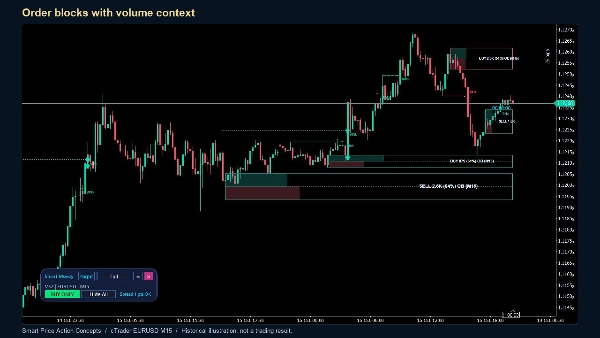
Trading product for Smart Price Action Concepts Indikator Fair Value Gap Order Block, image 4
Sejak 16/10/2026

Penerangan

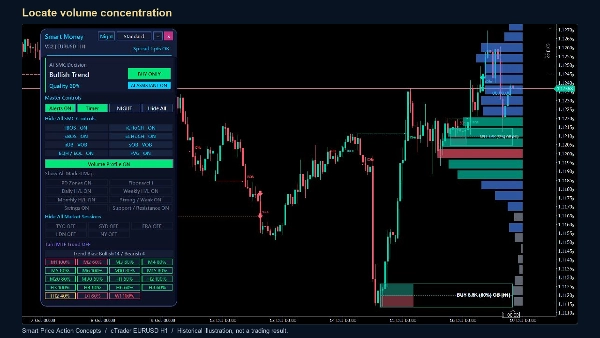
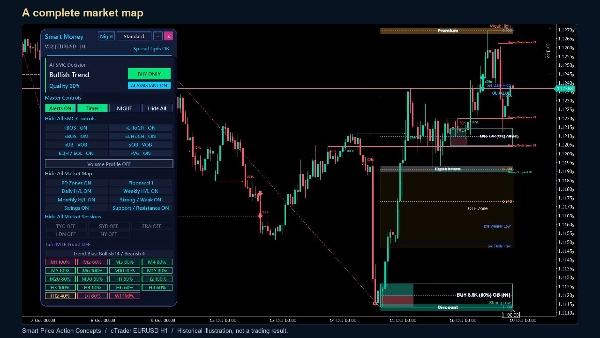
Smart Price Action Concepts brings market structure and price context together on your cTrader chart. Use one interactive dashboard to control internal and swing structure, order blocks, liquidity levels, fair value gaps and a broader market map.


STARTING CHARTS AND USE

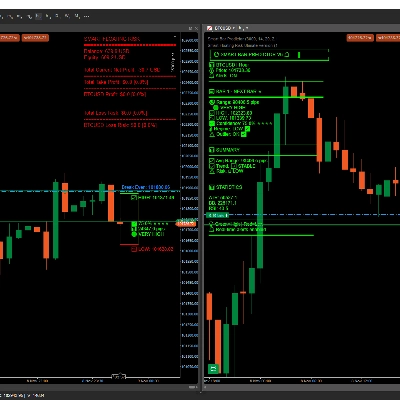
Designed for discretionary traders who use market structure and price action to plan chart analysis. EURUSD on H1 is a practical starting point used in the native checks. The illustrated examples also show M15, H4 and H12. Review your chosen instrument, period and broker data on a demo chart.


READ MARKET STRUCTURE

Follow bullish and bearish breaks of structure (BOS), changes of character (CHoCH), swing labels and equal highs/lows. Internal and swing structure can be displayed independently, so you can choose the detail appropriate for your analysis.


SEE THE AREAS THAT MATTER

Display order blocks with several presentation modes, including volume information, together with fair value gaps. Premium, equilibrium and discount levels, Fibonacci/OTE areas, previous daily/weekly/monthly highs and lows, strong/weak levels and support/resistance provide additional context. Translucent fills keep the candles visible.


COMPARE TIMEFRAMES

The dashboard combines enabled moving-average, MACD, ADX, Ichimoku and SAR votes and shows multi-timeframe agreement. Its quality percentage measures agreement among those analytical inputs. It is not a probability of profit or a historical win rate. Select a supported timeframe from the panel to change the chart.


CONTROL YOUR WORKSPACE

Move or collapse the panel, switch between compact, standard and full layouts, and choose panel and chart themes independently. Show or hide entire groups or individual features. The optional volume profile displays the distribution of chart volume, a point of control and a value area. Session controls display configured market-session ranges.


ALERTS AND SETUP

Attach the indicator to a supported time-based cTrader chart and allow its history to load. Choose the features you want to see and review the alert master switch and individual event settings. Desktop popups, sound and email are configurable; email requires the platform's email setup and valid sender/recipient addresses. Session times use the configured hours and offset. Volume calculations use the volume supplied by the cTrader chart, which is tick volume for this implementation.


IMPORTANT

This is an analytical indicator. It does not place or manage trades. Structure and zones develop as new bars arrive; pivot confirmation can appear on earlier candles, and invalidated zones can be removed. Historical screenshots illustrate the display, not an audited trading record or a promise of results. The panel describes its current calculation context, even when you scroll back through history.


Trading involves risk. Past performance does not guarantee future results.


Ringkasan

Profil indikator
Kategori indikator
Struktur pasaran (SMC)
Jenis output
Visualisasi
Isyarat
Keperluan data
Bar sahaja
Volum
Isyarat yang disokong
Pecahan paras

Perbincangan

Ulasan pelanggan

0.0
Ulasan: 0
Ulasan pelanggan
Belum ada ulasan untuk produk ini. Anda sudah mencuba produk tersebut? Jadilah yang pertama untuk berkongsi pendapat anda!

Soalan Lazim

Fair Value Gap
Order Block
Volume
Market Structure
Support & Resistance
Produk yang tersedia melalui cTrader Store, termasuk bot dagangan, indikator dan plugin, disediakan oleh pembangun pihak ketiga dan diberikan akses untuk tujuan maklumat dan teknikal sahaja. cTrader Store bukan broker dan tidak memberikan nasihat pelaburan, syor peribadi atau sebarang jaminan prestasi masa hadapan.

Lebih banyak produk daripada penulis ini

Indikator
RSI
VWAP
+5
Trend direction, chart signals, reversal zones and volume tools in one configurable indicator.

Anda juga mungkin suka

Indikator
SMC
VWAP
+4
Killzone Session and key levels with VWAP โ€“ Precision Meets Price Action
Indikator
ATR
RSI
+9
๐Ÿš€ MACARX Indicator - The Multi-Indicator Trend Fusion ๐Ÿš€
Indikator
ATR
RSI
+4
Adaptive Ichimoku with nine-factor confluence scoring, five signal types, smart TP/SL and an MTF panel.
Indikator
AI
ATR
+27
๐Ÿ”ฎ Smart Bar Predictor - Professional Volatility Forecasting Indicator
Indikator
Forex
BTCUSD
+11
๐Ÿ“ˆ Adaptive ALMA-Gaussian hybrid trend filter with precision smoothing and clear buy/sell signals.
Indikator
SMC
Forex
+15
Smart institutional order block & FVG scanner with alerts, zone merging, and HTF confluence.
Indikator
Forex
BTCUSD
+9
synchronize scroll position and zoom levels across multiple charts. Perfect for multi-timeframe analysis
Indikator
Forex
EURUSD
+7
Institutional Session Levels Pro OHLC,Prev(D,W,M OHLC)
Indikator
Volume
Key Levels
Dynamic Visible Range Volume Profile for cTrader. Real-time POC, Value Area & Smart Alerts for precise trading.
Indikator
Forex
NAS100
+3
volumen perfile
Indikator
Aggressive
Supertrend
+5
Stop trading with tunnel vision! ๐Ÿšซ The Heat Map Dashboard is an institutional-grade visual trading assistant
Indikator
ATR
RSI
+5
Binary Options Signals Pro โ€“ Precision Trading at Your Fingertips
Indikator
EMA
RSI
+5
MACD Colour Histogram with 11 Moving Average Types, Multi-timeframe confirmation and Sound Signal Alert.
Indikator
RSI
RSI on the main chart with 45/55 momentum levels, overbought/oversold levels, averaged RSI, and multi-timeframe support.
Indikator
ATR
Wedge
+2
Strong Supertrend Turn Market Movement into a Clear Map Market analysis
Indikator
MSS
Volume
+3
Rejection-based volume profile with tiered heat zones, POC levels and a fully draggable anchor on cTrader.
Indikator
ATR
RSI
+4
RSI bands drawn on price, confluence-scored BUY/SELL signals, an ATR stop with three targets
Indikator
Forex
EURUSD
+5
With this Fibonacci retracement indicator, traders have full control over the retracement levels displayed on the chart.

Harga

Sejak 16/10/2026