present
Sign up and get $50 off your first purchase
Trading product for Smart Trend Trading System Indicator Supertrend Key Levels, image 1
Smart Trend Trading System
Indicator
Version 1.1, Oct 2026
Windows, Mac
Trading product for Smart Trend Trading System Indicator Supertrend Key Levels, image 2
Trading product for Smart Trend Trading System Indicator Supertrend Key Levels, image 3
Trading product for Smart Trend Trading System Indicator Supertrend Key Levels, image 4
Trading product for Smart Trend Trading System Indicator Supertrend Key Levels, image 5
Trading product for Smart Trend Trading System Indicator Supertrend Key Levels, image 6
Trading product for Smart Trend Trading System Indicator Supertrend Key Levels, image 7
Trading product for Smart Trend Trading System Indicator Supertrend Key Levels, image 8
Since 16/10/2026

Description

Smart Trend Trading System

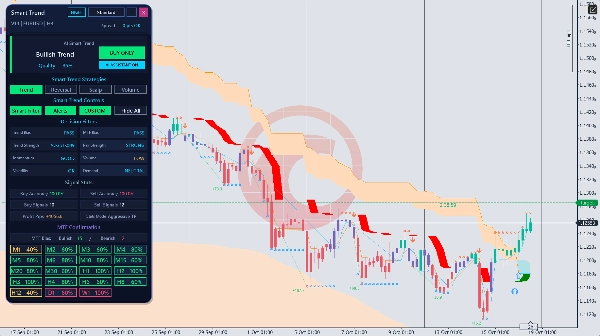
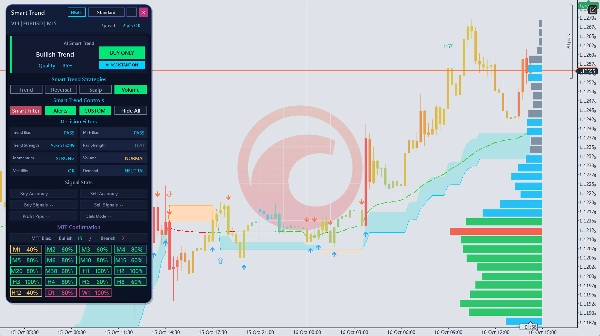
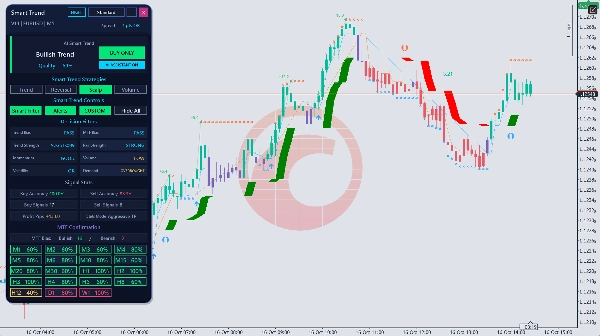
Bring trend direction, entry and exit signals, reversal zones and important price levels together on your cTrader chart. Smart Trend Trading System is an interactive indicator for traders who want to assess a setup and make their own trading decisions.

ONE SYSTEM. FOUR TRADING APPROACHES.

STTS organizes its trading approaches into four main categories:

• Scalping — follow shorter-term signals and market movements.

• Trend Trading — assess direction and look for opportunities within a trend.

• Reversal Trading — identify potential turning areas and changes in direction.

• Volume Trading — use volume-based information to assess market activity.

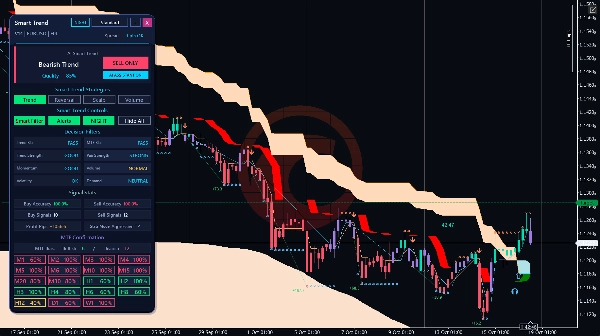
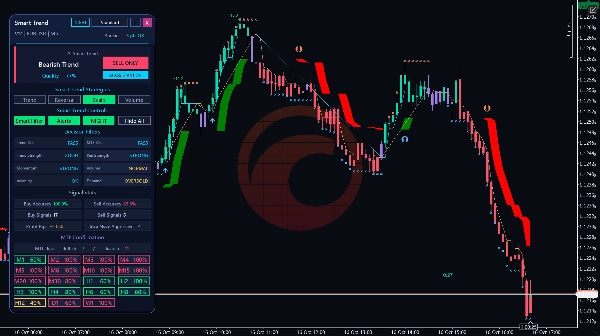
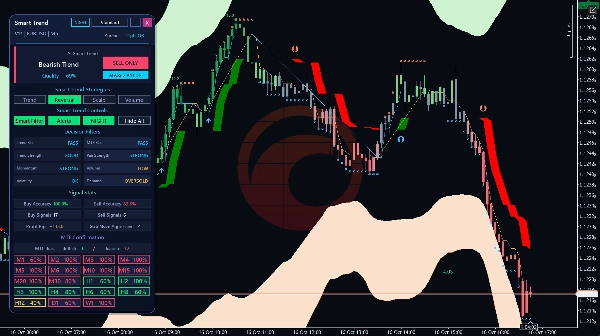
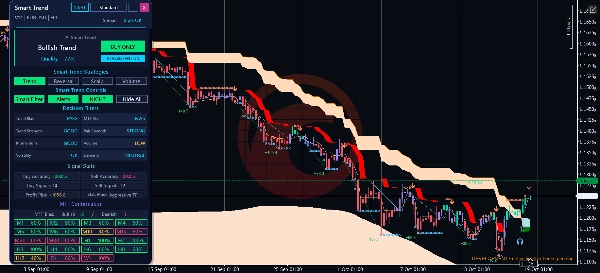
Use the on-chart panel to choose an approach, review decision filters and compare multi-timeframe confirmation. Move the panel to suit your chart layout, switch its presentation and show or hide the indicator's chart drawings as you work.

Start with one approach. Understand its signals and settings before exploring the others. A current directional assessment can differ from an older trend visible elsewhere on the chart.

USING STTS

STTS is a trend and volume indicator for manual analysis in cTrader Windows. It does not place or manage orders. EURUSD on H1 is a practical starting point used for the cTrader chart checks. The gallery compares the four approaches on M5, M15 and H1 charts. Check the selected approach and parameters against your instrument, period and broker data on a demo account before using them live.

DATA AND INTERPRETATION

Volume tools use the tick-volume data supplied by cTrader. The panel's AI Smart Trend assessment combines configured technical rules; its Quality percentage is agreement between those rules, not a probability of profit. NO DATA means the required evidence is unavailable.

SEE THE SYSTEM FOR YOURSELF

Review the on-chart signals, decision filters and multi-timeframe panel together. Panel accuracy figures, profit-pip totals and risk/reward annotations describe the indicator's analytical signal history under the selected settings. They are not account returns, a record of executed trades or a promise of future results.

— Issam Kassas, developer of Smart Trend Trading System

Trading involves risk. Past performance does not guarantee future results. Signals do not guarantee profits. Test your settings on a demo account before trading live.

Summary

Indicator profile

Discussion

Customer reviews

0.0
Reviews: 0
Customer reviews
No reviews for this product yet. Already tried it? Be the first to tell others!

FAQ

Supertrend
Key Levels
RSI
Volume
Moving Average
VWAP
Support & Resistance
Products available through cTrader Store, including trading bots, indicators and plugins, are provided by third-party developers and made available for informational and technical access purposes only. cTrader Store is not a broker and does not provide investment advice, personal recommendations or any guarantee of future performance.

More from this author
Indicator
Volume
Order Block
+3
Map market structure, order blocks, liquidity and key zones with an interactive cTrader dashboard.

You may also like

Indicator
Volume
Imbalance
+5
Professional OrderFlow Footprint Analysis ( Bid/ask, POC, VA, Delta, Absorption, Imbalance )
Indicator
ATR
BOS
+5
Market structure with BOS and CHoCH, order blocks, and retest buy/sell arrows with entry, stop and two targets
Indicator
Risk Dashboard
AI-powered daily range forecasts help traders spot volatility opportunities and plan stops and targets.
Indicator
ATR
Forex
+9
Auto-detect swing highs/lows. Spot reversals, map structure, and filter noise with adjustable strength.
Indicator
AI
ATR
+27
The Fibonacci Automated Levels Indicator is a smart trading tool that automatically detects the most recent market.
Indicator
SMC
VWAP
+4
Killzone Session and key levels with VWAP – Precision Meets Price Action
Indicator
RSI
VWAP
+5
📈 Anchored VWAP with auto High/Low, session resets, Daily VWAP & TWAP — precise, Pine-accurate port.
Indicator
ATR
Wedge
+2
Strong Supertrend Turn Market Movement into a Clear Map Market analysis
Indicator
MSS
Volume
+3
Rejection-based volume profile with tiered heat zones, POC levels and a fully draggable anchor on cTrader.
Indicator
Prop
Forex
+13
"Footprint Chart: Visualize bid-ask volume inside candles for clearer order flow and market depth insights."
Indicator
Forex
EURUSD
+3
ATR-normalized MA slope in degrees, comparable across all instruments. Color-coded labels flag strong trend moves.
Indicator
Imbalance
Key Levels
+2
A Next-Generation Adaptive Oscillator with Z-Score Regime Engine.
Indicator
Forex
Crypto
+2
PREMIUN INDICATOR
Indicator
Forex
Crypto
+5
This indicator combines two independent analytical engines into a single overlay on your chart.
Indicator
ATR
Prop
+5
Anchor volume profiles to pivots with POC, VAH, VAL and real-time insights for clearer trade decisions.
Indicator
Forex
BTCUSD
+11
Master trends with Smart ADX: MTF Scanner, precise Buy/Sell signals, Divergence & clear Exit targets 🎯
Indicator
CHOCH
Key Levels
+5
ZigZag Market Structure Identifier - Multi-Layer Scanner: Convergent Pivot Detection, 4-TF Overlay & Naked Chart Mode.
Indicator
cTreder Smart SMA

Price

Since 16/10/2026