
session indicator
مؤشر
7 عمليات الشراء
الإصدار 1.0، May 2025
Windows, Mac
4.3
التقييمات: 3
الوصف
تصور جلسات السوق الرئيسية + مستويات الأعلى/الأدنى بدقة
مؤشر جلسات التداول يبرز أهم جلسات التداول — لندن، نيويورك، و طوكيو — مباشرة على الرسم البياني الخاص بك. سواء كنت متداول سكالبينج أو متداول تأرجحي، فإن معرفة متى ترتفع أو تنخفض التقلبات أمر بالغ الأهمية. توفر هذه الأداة تلك الميزة بوضوح.
✅ الميزات الرئيسية:
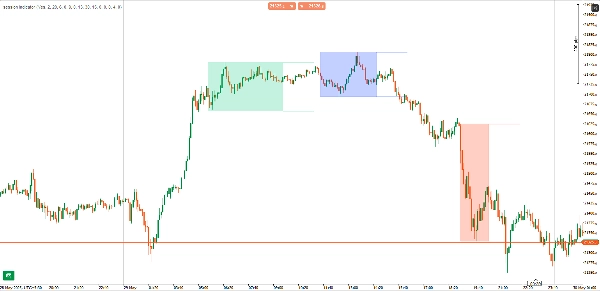
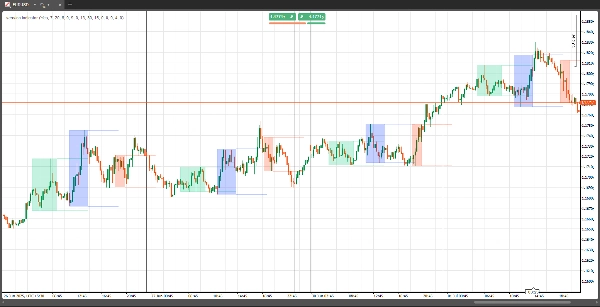
- مستطيلات الجلسة: تمييز كل جلسة بصريًا مع صناديق مظللة اختيارية
- خطوط الأعلى/الأدنى: رسم أعلى وأدنى الجلسة مع طول تمديد قابل للتخصيص
- عرض تاريخي: عرض بيانات الجلسة لليوم الحالي أو لأي عدد من الأيام السابقة
- قابل للتخصيص بالكامل: تعيين أوقات بدء/انتهاء الجلسة، تبديل المستطيلات تشغيل/إيقاف، وتحديد مدى امتداد الخطوط
- دعم أطر زمنية متعددة: يعمل على جميع أطر زمنية للرسم البياني
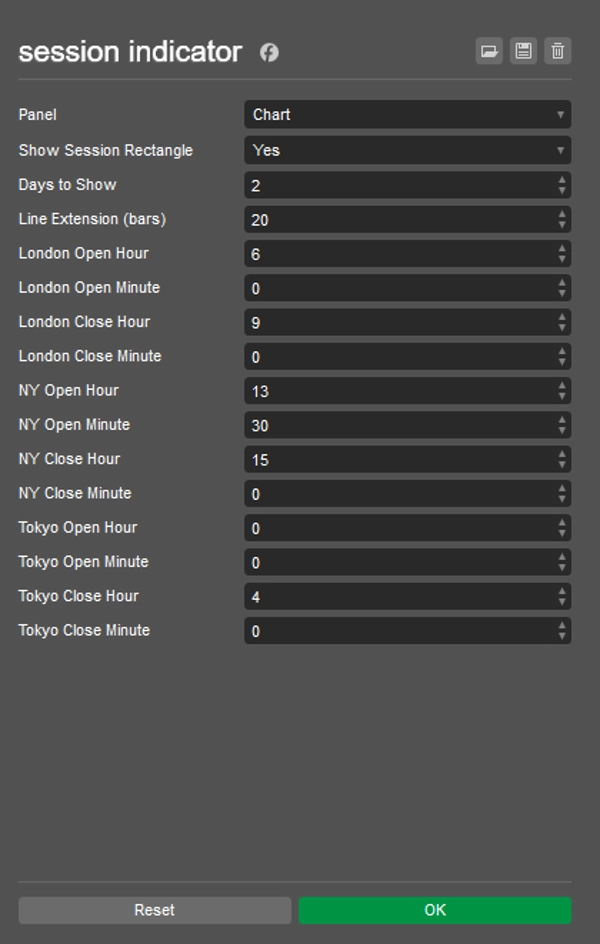
🔧 المعلمات:
- أوقات الجلسة: وقت بدء/انتهاء مخصص للندن، نيويورك، وطوكيو
- عرض المستطيل: تبديل صناديق الجلسة المظللة
- الأيام للعرض: عدد الأيام التاريخية لعرض بيانات الجلسة
- أشرطة تمديد الخط: التحكم في مدى امتداد خطوط الأعلى/الأدنى للجلسة على الرسم البياني
🧠 لماذا تستخدمه؟
فهم أنماط التقلبات القائمة على الجلسات هو حجر الزاوية في التداول المؤسسي. يساعدك هذا المؤشر على:
- توقيت الدخول والخروج حول مناطق السيولة الرئيسية
- تحديد أعلى وأدنى الجلسة لاستراتيجيات الاختراق أو الانعكاس
- فصل بصري لتداخلات الجلسات (مثل لندن–نيويورك)
الملخص
ملخص الذكاء الاصطناعي
The Session Indicator is a charting tool designed to highlight key global trading sessions—London, New York, and Tokyo—directly on trading charts. It visually marks each session with optional shaded rectangles and plots session high and low price levels, with customizable line extension lengths. Users can view session data for the current day or multiple previous days, supporting analysis across various timeframes.
Key features include full customization of session start and end times, toggling of session rectangles, and control over how far high/low lines extend. The indicator works on all chart timeframes and helps traders identify volatility patterns associated with institutional trading sessions.
This tool aids in timing entries and exits around key liquidity zones, recognizing session highs and lows for breakout or reversal strategies, and visually distinguishing overlapping sessions such as London-New York. It supports markets including Forex, indices, and major symbols like NAS100. The indicator outputs visual signals based on market structure concepts and is suitable for traders employing reversal strategies.
ملف تعريف المؤشر
فئة المؤشر
هيكل السوق (SMC)
نوع المخرجات
التصور
متطلبات البيانات
أعمدة السعر فقط
الإشارات المدعومة
الانعكاس
تقييمات العملاء
4.3
التقييمات: 3
5 | 67 % | |
4 | 0 % | |
3 | 33 % | |
2 | 0 % | |
1 | 0 % |
تقييمات العملاء
June 2, 2025
Useful setup helper for traders who care about timing windows. It gives value around session timing, but the value depends on the trader's schedule. I would compare Asia range, London break and New York continuation before trusting it. The tool is most useful when it keeps the trader out of dead hours.
June 1, 2025
June 1, 2025
Decent trade support for session timing. it helps match setups with active market hours, especially when used for planning trades around active sessions. The session view is useful for London and New York, especially when checking the first 60 minutes. The tool is most useful when it keeps the trader out of dead hours.
مناقشة
الأسئلة الشائعة
Prop
Forex
Indices
Fair Value Gap
SMC
NAS100
يتم توفير المنتجات المتاحة من خلال cTrader Store، بما في ذلك روبوتات التداول والمؤشرات والإضافات، من قبل مطوري الطرف الثالث وإتاحتها لأغراض الوصول المعلوماتي والفني فقط. cTrader Store ليس وسيطًا ولا يقدم نصائح استثمارية أو توصيات شخصية أو أي ضمان للأداء المستقبلي.


السعر
منذ 30/05/2025
40
المبيعات