
الوصف
خوارزمية التتبع الذكية
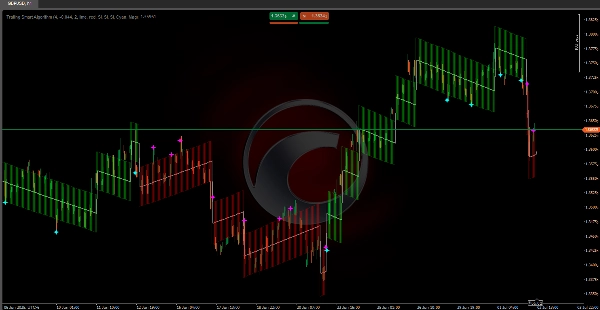
https://chartshots.spotware.com/c/69f0f1d89000b
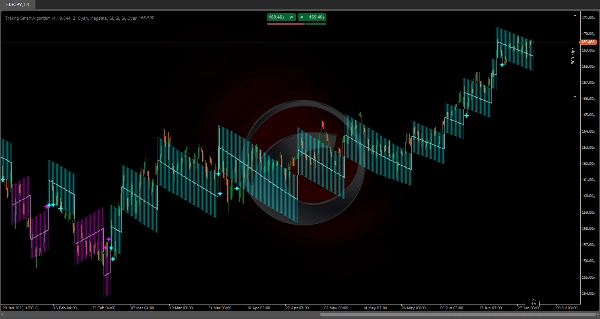
تدمج الخوارزميات الرياضية 🧠 المصممة خصيصًا لتتبع السعر باستمرار في أي حالة سوقية 🌐.
هيكل حسابها يضمن بقاء خط الاتجاه متزامنًا دائمًا مع تحركات السعر، متجنبًا التأخير النموذجي للمؤشرات التقليدية ⏳.
على عكس الخوارزميات التقليدية، يستخدم هذا النظام قياسات تقلب دقيقة 📊 ويطبق تعديلات تلقائية ⚙️ تضمن تتبعًا مثاليًا. حساباته الداخلية مبنية لتقديم تمثيل دقيق لاتجاه السوق، مع الحفاظ على الدقة خلال كل من التحركات السريعة ⚡ وتطور الاتجاه التدريجي 🕊️.
https://chartshots.spotware.com/c/69f0f218591b0
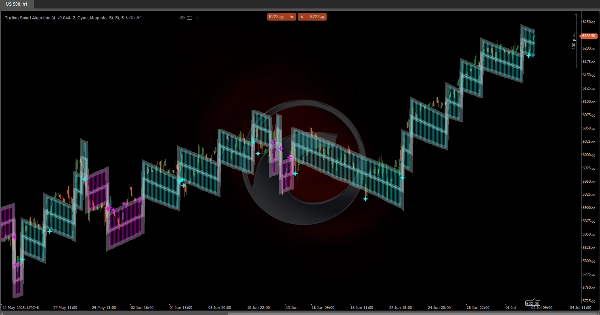
💡 كيف تعمل؟
يعمل المؤشر باستخدام نظام خطوة تكيفي يتحرك في اتجاه الاتجاه السائد.
يعتمد على ثلاثة مكونات رئيسية:
https://chartshots.spotware.com/c/69f0f2b19e4d3
1️⃣ كشف تغير الاتجاه
يراقب النظام السعر باستمرار لاكتشاف تحركات كبيرة تتجاوز حدًا معينًا (زناد الاندفاع 🎯).
عندما يتحرك السعر بعيدًا بما يكفي عن خط الاتجاه الحالي، يتعرف المؤشر على تغير محتمل في الاتجاه ويعيد تموضع خطه الرئيسي.
2️⃣ التتبع الديناميكي
بمجرد تحديد الاتجاه، يتحرك خط الاتجاه خطوة بخطوة 🪜 في نفس اتجاه السوق.
يتم حساب كل خطوة بناءً على التقلب الحالي (ATR 📈):
• في الأسواق الأكثر تقلبًا، تكون الخطوات أكبر 🌊
• في الأسواق الأهدأ، تكون الخطوات أصغر 🌿
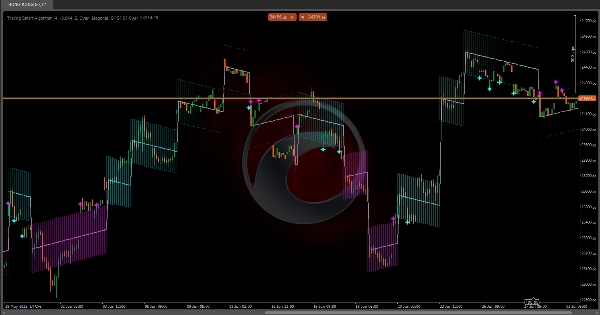
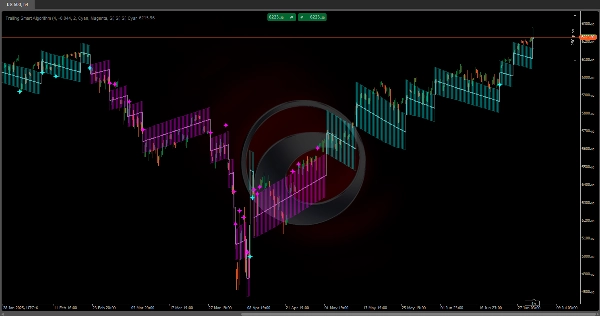
3️⃣ قناة التقلب
تتشكل قناة حول الخط الرئيسي (الأشرطة العلوية والسفلية) تمثل منطقة التقلب الطبيعية 📉📈.
تساعد هذه القناة في تحديد ما إذا كان السعر يتصرف ضمن المعايير الطبيعية أو يقوم بـ تحركات قصوى 🚨.
📏 قناة التقلب
• الشريط العلوي: الحد الأعلى لقناة التقلب
• الشريط السفلي: الحد الأدنى لقناة التقلب
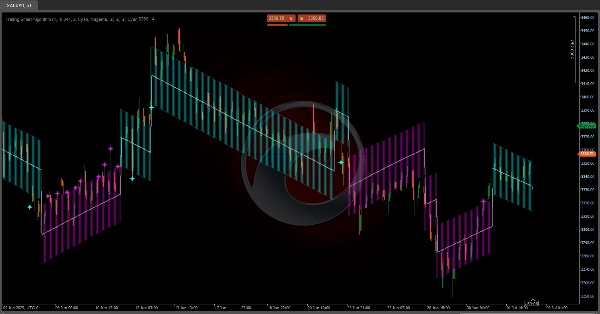
✨ إشارات إعادة الاختبار
• النجوم السماوية 🌟: يلمس السعر أو يعبر الشريط السفلي خلال اتجاه صاعد
• النجوم الأرجوانية ⭐: يلمس السعر أو يعبر الشريط العلوي خلال اتجاه هابط
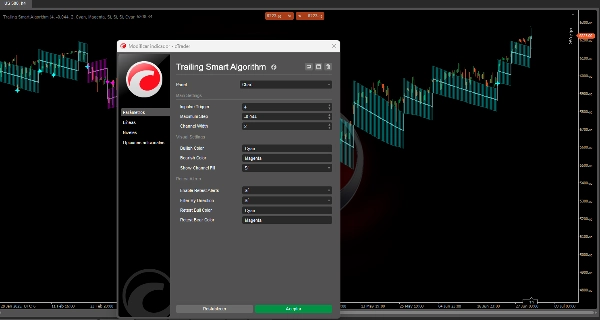
⚙️ إعدادات المعلمات
🔹 المعلمات الرئيسية
زناد الاندفاع (القيمة الافتراضية: 4)
ما وظيفته؟
يحدد الحساسية لاكتشاف تغيرات الاتجاه. هو مضاعف ATR يحدد مقدار حركة السعر اللازمة لتحفيز تغير الاتجاه.
التأثير عند التعديل:
• القيم الأعلى (5–8):
- مقاومة أكبر لتغيرات الاتجاه 🛡️
- إشارات خاطئة أقل
- استجابة أبطأ للتحولات الحقيقية
• القيم الأدنى (2–3):
- حساسية أعلى 🎯
- رد فعل أسرع
- أكثر احتمالًا لإنتاج إشارات خاطئة في الأسواق الجانبية
الخطوة القصوى (القيمة الافتراضية: -0.044)
ما وظيفته؟
يحدد الحجم الأقصى لكل خطوة التي يمكن أن يتخذها خط الاتجاه. هي قيمة سالبة تعمل كحد أقصى.
التأثير عند التعديل:
• أقل سلبية (-0.020 إلى -0.030):
- خطوات أكبر 🚀
- تتبع أكثر عدوانية للاتجاه
• أكثر سلبية (-0.050 إلى -0.080):
- خطوات أصغر، أكثر تدريجية 🌱
- متابعة أكثر تحفظًا
عرض القناة (القيمة الافتراضية: 2)
ما وظيفته؟
يحدد عرض قناة التقلب حول الخط الرئيسي.
التأثير عند التعديل:
• القيم الأعلى (3–4):
- قناة أوسع 🟢
- إشارات إعادة اختبار أقل
- تحمل أكبر للتقلب
• القيم الأدنى (1–1.5):
- قناة أضيق 🔴
- إشارات إعادة اختبار أكثر
- حساسية أكبر للضوضاء
🎨 المعلمات المرئية
لون الصعود / لون الهبوط
تحدد الألوان لـ الاتجاهات الصاعدة والهابطة على التوالي.
عرض تعبئة القناة
تمكين أو تعطيل التعبئة المرئية لقناة التقلب 🌈.
🔔 إعدادات إعادة الاختبار
تمكين تنبيهات إعادة الاختبار
تبديل إشارات إعادة الاختبار عند لمس السعر لأشرطة القناة.
التصفية حسب الاتجاه
عند التمكين، يعرض فقط إشارات إعادة الاختبار المطابقة للاتجاه الحالي:
• في اتجاه صاعد: فقط الإشارات على الشريط السفلي
• في اتجاه هابط: فقط الإشارات على الشريط العلوي
🌟 ملخص إشارات إعادة الاختبار
• النجم السماوي على الشريط السفلي: ارتداد صعودي محتمل من دعم ديناميكي ✅
• النجم الأرجواني على الشريط العلوي: ارتداد هبوطي محتمل من مقاومة ديناميكية ❌
الملخص
تقييمات العملاء
5 | 100 % | |
4 | 0 % | |
3 | 0 % | |
2 | 0 % | |
1 | 0 % |


