
CandleCounterAlex
Indikator
1 pembelian
Versi 1.0, Aug 2025
Windows, Mac
4.5
Ulasan: 2
Deskripsi
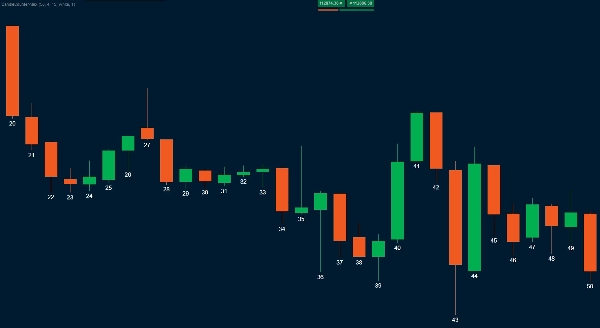
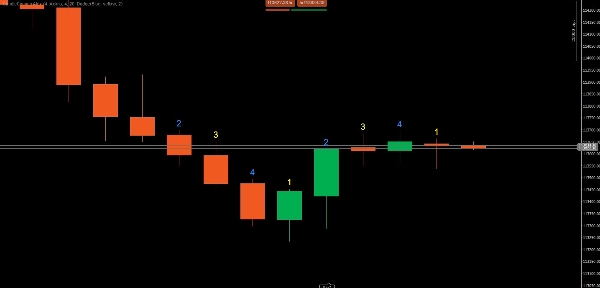
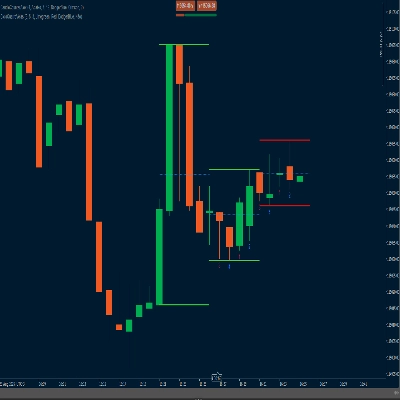
Indikator Candle Counter Alex dirancang untuk trader yang mengandalkan penghitungan candle dalam siklus.
Ini menampilkan angka langsung di grafik, memulai ulang urutan sesuai dengan panjang siklus yang dikonfigurasi.
Fitur:
- Tentukan panjang siklus (misalnya, 4 → hitung 1, 2, 3, 4).
- Pilih berapa banyak siklus yang terlihat yang Anda inginkan di grafik.
- Sesuaikan ukuran font dan offset dalam pips untuk penempatan angka yang tepat.
- Posisi yang dapat disesuaikan: pilih apakah angka muncul di atas high atau di bawah low setiap candle.
- Sorotan visual:
-
- Candle ganjil dengan satu warna.
- Candle genap dengan warna lain.
Manfaat:
Identifikasi siklus candle dengan cepat.
Warna yang bergantian membuat pembacaan lebih intuitif.
Sepenuhnya dapat disesuaikan agar sesuai dengan gaya trader.
Sekarang dengan fleksibilitas lengkap untuk penempatan angka.
Sempurna untuk trader yang menggunakan strategi berbasis siklus, pola candle, atau pengaturan berbasis waktu.
Ringkasan
Profil indikator
Ulasan pelanggan
4.5
Ulasan: 2
5 | 50 % | |
4 | 50 % | |
3 | 0 % | |
2 | 0 % | |
1 | 0 % |
Ulasan pelanggan
September 1, 2025
Random clicks become easier to catch, but it works better with a written plan.
August 25, 2025
Diskusi
Pertanyaan umum
Produk-produk yang tersedia melalui cTrader Store, termasuk bot trading, indikator, dan plugin, disediakan oleh pengembang pihak ketiga serta hanya ditujukan untuk akses teknis dan informasi. cTrader Store bukan broker dan tidak menyediakan saran investasi, rekomendasi pribadi, atau jaminan apa pun tentang kinerja di masa mendatang.
Produk lain dari penulis ini


![Logo "[Hamster-Coder] Bollinger Bands"](https://cdn.ctrader.com/image/webp/21d8e5d6-fb11-4bac-b9ee-cd05c2b76804_30327)


![Logo "High-Low Divergence [Iridio Capital]"](https://cdn.ctrader.com/image/webp/443c4661-7abb-40f1-842f-4b6ec560649b_40914)


Harga
Sejak 18/08/2025
1
Penjualan
109
Instal gratis