
Deskripsi
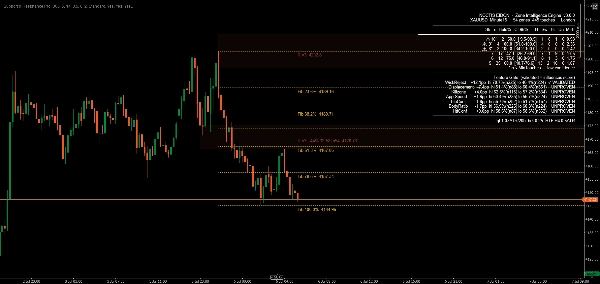
Support & Resistance Pro mengidentifikasi zona support dan resistance dan — tidak seperti sebagian besar alat S/R — mengukur apakah zona tersebut benar-benar berfungsi, menggunakan mesin statistik independen yang dibangun berdasarkan data historis nyata daripada asumsi. Setiap zona menunjukkan statistik tingkat tahan dengan interval kepercayaan, dihitung dari populasi zona historis lengkap, termasuk zona yang kemudian pecah dan menghilang dari grafik. Sebagian besar indikator dalam kategori ini hanya menghitung level yang masih terlihat hari ini, yang secara diam-diam membesar-besarkan setiap klaim kekuatan yang dibuat. Yang ini tidak.
Fitur Utama
- Zona yang Divalidasi Secara Statistik Setiap zona membawa tingkat tahan yang nyata dan diukur secara historis dengan interval kepercayaan 95% — bukan skor kekuatan yang diasumsikan. Satu sinyal, penolakan sumbu pada titik kontak, telah divalidasi secara formal: dikonfirmasi pada EURUSD dan Bitcoin, di berbagai kerangka waktu, termasuk uji out-of-sample asli di mana efeknya mempertahankan kekuatan pada data yang belum pernah dilihat.
- Pembalikan Peran Otomatis Support yang pecah secara otomatis menjadi resistance, dan sebaliknya, dengan penanda visual yang jelas — indikator melacak sisi harga tempat zona berada dan mewarnainya sesuai, bukan mengunci warna berdasarkan bagaimana zona awalnya terbentuk.
- Konfluensi Kerangka Waktu Lebih Tinggi Zona pada grafik Anda diperiksa terhadap kerangka waktu lebih tinggi pilihan Anda, dengan struktur HTF yang cocok digambar langsung di grafik sebagai overlay visual terpisah.
- Integrasi Fibonacci Retracement Level retracement Fibonacci otomatis dari ayunan terbaru, masing-masing diberi label dengan rasio dan harga tepat dalam presisi asli broker Anda, secara otomatis dibersihkan dari zona terdekat sehingga label tidak pernah tumpang tindih.
- Peringatan Jenuh Zona yang diuji terlalu sering diberi tanda daripada diasumsikan lebih kuat — data kami menunjukkan zona yang diuji secara intens cenderung berkinerja lebih buruk, bukan lebih baik, kemungkinan karena likuiditas istirahat mereka sudah habis digunakan.
- Gerbang Validasi Terbuka Enam sinyal kandidat tambahan — rasio badan, kecepatan pendekatan, waktu sesi/killzone, dan pengujian perpindahan — ditampilkan secara langsung pada panel statistik bawaan dengan pembacaan tingkat tahan mereka sendiri. Mereka tidak memengaruhi skor atau peringkat apa pun sampai masing-masing secara independen melewati batas bukti yang sama seperti penolakan sumbu. Anda melihat dengan tepat apa yang terbukti dan apa yang belum.
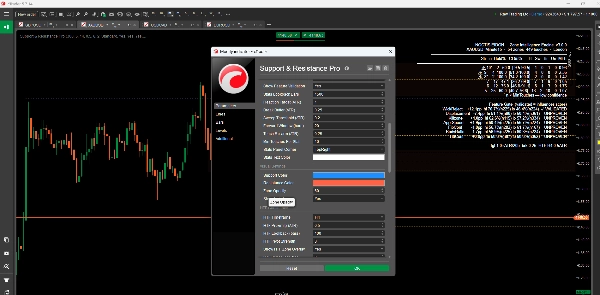
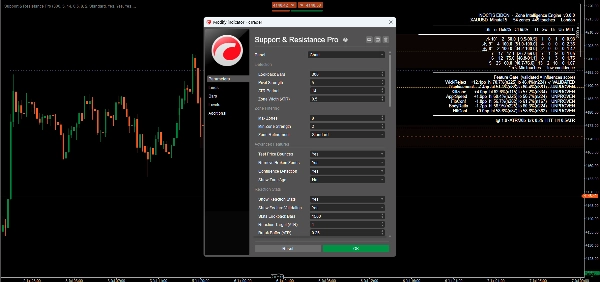
- Pengaturan yang Dapat Disesuaikan Kontrol parameter yang luas di seluruh sensitivitas deteksi, penyaringan zona, gaya visual, dan perilaku peringatan.
- Peringatan Waktu Nyata Peringatan pop-up, email, dan suara yang dapat dikonfigurasi untuk sentuhan zona, breakout, dan peristiwa konfluensi, dapat diaktifkan atau dinonaktifkan secara independen per saluran.
Manfaat
- Bukti daripada asumsi: setiap statistik di grafik dapat diperiksa secara independen — indikator menyertakan alat verifikasi in-sample/out-of-sample sendiri
- Tanpa bias kelangsungan hidup: klaim kekuatan dibangun berdasarkan populasi zona historis lengkap, bukan hanya level yang kebetulan bertahan
- Pengungkapan jujur: sinyal yang terbukti dan yang belum terbukti diberi label seperti itu, di grafik, setiap saat
Ideal Untuk
Trader yang ingin melihat bukti statistik di balik sebuah level, bukan hanya sebuah garis — day trader, swing trader, dan trader sistematis di forex, crypto, dan instrumen lain yang mencari pendekatan yang diukur secara ketat terhadap support dan resistance.
Kesimpulan
Support & Resistance Pro dibangun berdasarkan satu prinsip: klaim kekuatan tidak nyata sampai diukur. Satu sinyal telah melewati batas itu dengan konfirmasi lintas instrumen, lintas kerangka waktu, dan out-of-sample. Sisanya ditampilkan dengan jujur sebagai masih dalam pengujian — karena angka yang tidak bisa Anda verifikasi sama sekali tidak layak ditampilkan.
Ringkasan
- Dynamic support and resistance levels that adjust in real-time based on recent price action.
- Multi-timeframe analysis to view levels across different timeframes for a comprehensive market overview.
- Calculation and display of pivot points to mark potential intraday reversal zones and target prices.
- Highlighting of psychological price levels (round numbers) to gauge market sentiment.
- Integration of Fibonacci retracement levels to assist in identifying support and resistance during price corrections.
- Customizable settings for lookback periods, visualization styles, and color schemes to suit individual trading preferences.
- Clear graphical representation for easy identification of market conditions.
- Configurable real-time alerts when prices approach critical levels.
This indicator supports various trading styles including scalping, day trading, and swing trading, and is suitable for traders in forex, commodities, stocks, and indices markets. It is intended for both beginner and experienced traders seeking structured market analysis and enhanced decision-making through reliable support and resistance data.
Ulasan pelanggan
5 | 100 % | |
4 | 0 % | |
3 | 0 % | |
2 | 0 % | |
1 | 0 % |


