
Deskripsi
🟢 Indikator Heiken Ashi Halus untuk cTrader
Berdagang dengan kejelasan. Ikuti tren dengan percaya diri.
Indikator Heiken Ashi Halus adalah alat grafik yang disempurnakan yang dirancang untuk menyaring kebisingan pasar dan menyoroti momentum harga yang sebenarnya. Dibuat untuk platform cTrader, indikator ini menggabungkan candlestick Heiken Ashi tradisional dengan algoritma perataan untuk memberikan sinyal tren yang lebih bersih dan lebih dapat diandalkan.
🔍 Fitur Utama
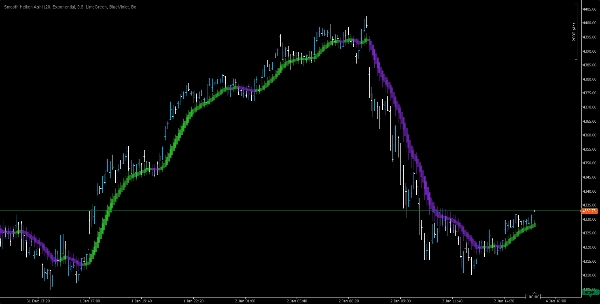
• Candlestick Heiken Ashi yang Diperhalus
Kurangi sinyal palsu dan aksi harga yang bergejolak dengan lilin yang ditingkatkan secara visual yang menekankan arah tren.
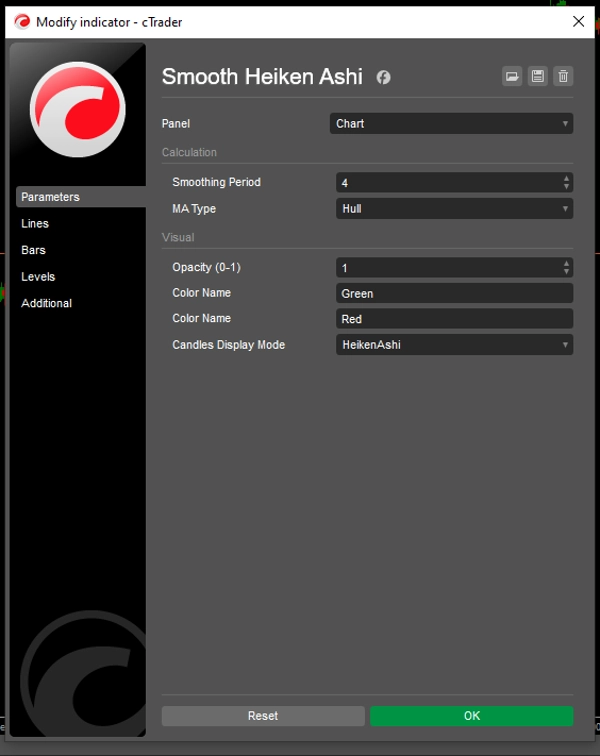
• Opsi Perataan yang Dapat Disesuaikan
Sesuaikan faktor perataan agar sesuai dengan gaya trading Anda—baik Anda scalping atau swing trading.
• Garis Overlay Tren
Sebuah kurva dinamis menutupi lilin untuk memperkuat kekuatan tren dan potensi pembalikan.
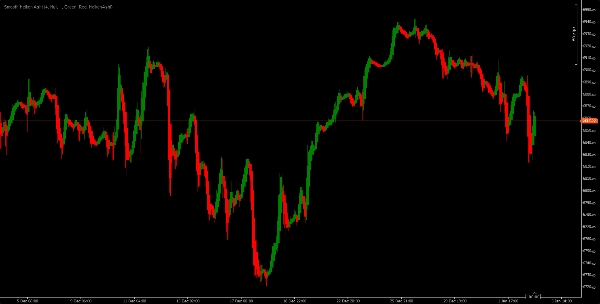
• Visual yang Bersih
Gradasi warna yang elegan dan desain minimalis membuat grafik Anda lebih mudah dibaca dan diinterpretasikan.
📈 Ideal Untuk
• Strategi mengikuti tren
• Konfirmasi momentum
• Menyaring kebisingan pasar
• Trader visual yang mencari kejelasan dan presisi
Heiken Ashi Halus membantu Anda tetap fokus pada hal yang penting—arah harga, bukan gangguan. Baik Anda membangun sistem algoritmik atau berdagang secara manual, indikator ini menambahkan lapisan kepercayaan pada analisis Anda.
Ringkasan
Ulasan pelanggan
5 | 100 % | |
4 | 0 % | |
3 | 0 % | |
2 | 0 % | |
1 | 0 % |


![Logo "[Hamster-Coder] Pivot Points MTF"](https://cdn.ctrader.com/image/webp/4c143e5a-309c-40e3-a578-f04d1e133ffa_31159)
